Dr Angela Spadafranca, PhD.
International Center for the Assessment of Nutritional Status (ICANS), Via Botticelli 21, 20133 Milan, Italy. University of Milan.
Phone: +39 02 50316652. Fax: +39 02 50316191. E-mail: angela.spadafranca@unimi.it
© 2019 Sift Desk Journals. All Rights Reserved
VOLUME: 3 ISSUE: 6
Page No: 509-515
Dr Angela Spadafranca, PhD.
International Center for the Assessment of Nutritional Status (ICANS), Via Botticelli 21, 20133 Milan, Italy. University of Milan.
Phone: +39 02 50316652. Fax: +39 02 50316191. E-mail: angela.spadafranca@unimi.it
Spadafranca A1*, Bertoli S1 and Battezzati A1
1 International Center for the Assessment of Nutritional Status (ICANS), University of Milan, Italy.
Kaisun Nesa Lesa(kaisun_nesa@yahoo.com)
%c3%81ngela Garc%c3%ada-Gonz%c3%a1lez(angargon@ceu.es)
Koichiro Mori(koichiro.mori@hokto-kinoko.co.jp)
Dr. Angela Spadafranca, ASSOCIATION BETWEEN SNACK ENERGY INTAKE IN CHILDREN AGED 8-11 AND MATERNAL BODY MASS INDEX: RESULTS FROM AN OBSERVATIONAL STUDY IN AN ELEMENTARY SCHOOL OF MILAN(2018) SDRP Journal of Food Science & Technology 3(6)
Background
Family and school context plays an important role in education and may affect children’s eating behavior. The first aim of this study was to describe the energy and nutrient intake derived from snacks brought from home to school in children 8-11 years old. Secondly, we investigated the association of snacking nutritional features with child and parents’ weight status.
Methods
The study involved 109 students and their parents in an elementary school of Milan (Italy). On four randomized experimental days, teachers took a picture of their snacks. Data about nutritional composition was obtained by MetaDieta program or from nutritional labels. Anthropometric measurements were taken in children, while parents’ weight and height information was obtained via self-report. Data was analyzed using general linear regression models.
Results
Complete and valid data was obtained for 95 students (52 males and 43 females) and their parents. 15% of the sample never brought any snack to school. 46.2% of the snacks were packaged. In particular, 36.8% were sweet and 9.4% savory items. 23.8% were sugary drinks, such as fruit juice or cold iced tea. Consumption of fresh fruit, yoghurt or dried nuts was very low. The average energy intake derived from snacks was 205 kcal (±74). No significant difference in snacking behaviors was observed in relation to sex or nationality. No significant association was found between energy intake derived from snacks and children’s body mass index z score (r= -0.04, p=0.7), however we found a direct and significant correlation, adjusted for age, education level and nationality with maternal body mass index (b= 0.36, p=0.01).
Conclusion
This study suggests that during school age mothers play an important role in the control of children’s food intake and that their nutritional status may affect food choices for their children. Educational interventions involving the whole family should be encouraged in order to prevent imbalanced food behaviors in children.
Keywords: family food habits, obesity, parents, weight status
Childhood obesity rates have risen to an alarming level over the past 3 decades [1] and primary school years have recently been identified as a potentially “critical period” [2] in different Western societies [3,4]. Evidence so far attributes this phenomenon to the interplay between genetic and environmental factors [5]. Family and school context plays an important role in education and may affect eating behavior [6]. During school age, there are many moments of the day when food choice is affected by parents or caregivers, because rarely do children consume their meals or spend time alone. Meal distribution throughout the day is an important point in food education: most studies in adults suggest that greater eating frequency is associated with a healthier status [7-9]. Fabry et al [10] were the first to explore this effect in children. They performed an interventional study on 226 children, aged 6 to 16, and found that children who were provided three meals per day had an increased tendency to deposit fat, compared with those who were given seven or five meals per day in smaller servings. National Recommended Energy and Nutrient Intake Levels [11] report that the total daily energy intake (EI) should be distributed over at least three meals, better if five: breakfast (15-20% EI), midmorning snack (5-10% EI), lunch (30-40% EI), afternoon snack (5-10% EI) and dinner (30% EI).
There are many possible physiological advantages associated with frequent eating that may improve weight control: frequent eating may help people regulate appetite and daily energy compensation, increase the carbohydrate-to-fat ratio in their diet and shift the temporal distribution of energy intake towards earlier parts of the day [12]. The midmorning snack consumption may mitigate hunger at lunch. There is considerable evidence that high-protein foods are more satiating than those that are high in carbohydrate and/or fat [13]; that fiber-rich foods are more satiating than low-fiber foods [14] and that energy-dense foods are less satiating than those with lower energy density [15]. This evidence suggests that energy intake and nutritional composition should be considered when it comes to choosing snacks.
The first aim of this study was to describe the snacking behaviors of a cohort of children from a primary school of Milan (Italy).
The second aim was to investigate the correlation between snacking behaviors and weight status of children. Thirdly, since the children brought snacks from home and their mother or father was very likely involved in the choice of the snack, we analyzed the association between snacking behaviors of children and nutritional status of their parents.
Study design
This research is a cross-section observational study performed between February and April 2017 at public elementary school G. Rodari of Milan, Italy. The study was proposed to all children attending the school with an age comprised between 8 and 11 years. On four randomized days, we analyzed energy and nutrients intakes derived from snacks brought to school and consumed during the midmorning break. Snack consumption was recorded by means of photos taken by teachers before ingestion. Anthropometric data about the children and their parents was collected at the beginning of the study.
Collection of nutritional data about snacks
On four occasions, the teachers took a photo of the snacks brought from home by the children. Specific instructions were given in order to standardize the shooting of the pictures: the snack was to be placed onto a table and the photo was to be taken with a digital camera (Canon Italia PowerShot SX430 IS) at a distance of about 30 cm with no zoom. The size of the portions was estimated based on weight information shown on the nutritional label, in the case of packaged snacks, or based on the number of pieces, in the case of snacks such as fruits. Data was collected on four not consecutive days in the same month. The dates of experimental days were unknown to the students and their families. For the sake of privacy, the children’s faces were not photographed. However, every snack was given a code referring to the child’s name. This method of detection made it possible to identify directly the type of product and its size in an objective way, as opposed to a food diary method where data is self-reported [16]. Nutritional data was obtained from labels or by databases included in MetaDieta software.
Anthropometry
All children underwent weight and height measurements. Anthropometric measurements were taken by the same operator following international guidelines [17].
Weight was measured to the nearest 100 g and height to the nearest 0.1 cm using a scale with incorporated stadiometer (SECA 711, SECA, Hamburg, Germany). BMI was calculated as weight (kg)/height (m)2 and classified according to the WHO Child Growth Standards as BMI z score (http://www.who.int/childgrowth/standards) [18].
Parents’ weight and height data was collected by self-administered questionnaire.
The school review board approved the study’s procedures and both children and parents or caregivers provided written informed consent. The study was carried out according to the Declaration of Helsinki.
Statistical analysis
Statistical analysis was performed using SPSS V. 23.
All data was expressed as mean ± sd (standard deviation) for continuous variables and as percentage for categorical variables. Linear regression was used to investigate the association between snack energy intake, child’s BMI z score and parents’ BMI. General linear regression models were adjusted for age, sex, educational level and age. The BMI z score was evaluated according to WHO Child Growth Standards (2007). Energy snack intake of children from mothers with BMI ≥25 kg/m2 was compared to that of children from mothers with BMI ≤24.9 kg/m2 using an unpaired t test. The significance level for all statistical analyses was defined as p value ≤ 0.05.
General characteristics of the children sample
The study involved 109 students, but complete and valid data was obtained from 95 students (52 males and 43 females) and their parents. Fourteen children were absent on more than two experimental days, so they were not included in the analysis. 60% of the final sample were Italian children, while 40% were foreign (9.6% from North Africa, 7.7% from South America, 19.2% China and 3.5% from Eastern Europe). The average age was 9.8 years (SD ± 0.9). The distribution of the children’s sample in terms of BMI z score was as follows: 59% normal weight (-2≤ z score BMI≤1), 28% overweight (1≤z score BMI≤2), 13% obese (z score BMI>2).
15% (n=14) of the children (8 normal weight, 4 overweight and 2 obese) never brought their midmorning snack from home on the days when teachers took the pictures.
Snacking behaviors
Observing all pictures (n=262), we found that 46.2% were packaged snacks, of which 36.8% were sweet packaged snacks and 9.4% savory. 23.8% of the snacks were sugary drinks, such as fruit juice or cold iced tea. Consumption of fresh fruit, yoghurt or dried nuts was very low (Figure 1).
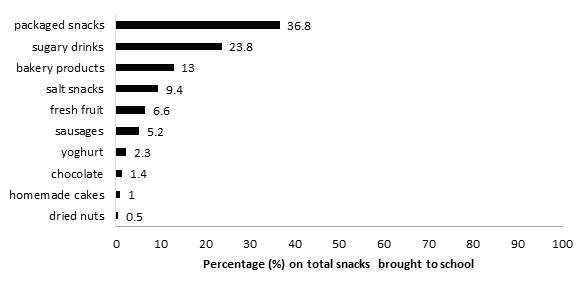
Figure 1. Type and frequency (%) of snacks brought from home to school.
The average energy intake derived from snacks was 205 kcal (±74) (minimum 71 kcal, maximum 552 kcal). The average macronutrient composition was 62± 17% from carbohydrates, of which 37± 25% simple sugars; 29± 12 from fats% of which 12.5 ± 6.7% saturated fats. The average protein intake derived from snacks was 8 g ± 3.8 g, while fiber intake was 1.7 ± 0.8 g. No difference has been observed in terms of nutrient composition of snacks in relation to sex and nationality.
General characteristics of the parents
The average age of parents was respectively 42± 7 years for mothers (n=95) and 45± 6 years for fathers (n=95). As for the education level, 24% of the mothers had attained compulsory education, 42% a secondary school degree and 34% a higher education degree; among the fathers, 30% had attained compulsory education, 35% a secondary school degree and 35% a higher education degree.
BMI distribution among mothers was: 71.7% normal weight (18.5 kg/m2≤BMI≤24.9 kg/m2), 23.2% overweight (25 kg/m2≤BMI≤29.9 kg/m2), 5.1% obese (BMI≥30 kg/m2).
BMI distribution among fathers was: 46% normal weight, 50% overweight and 4% obese.
BMI-z score of children was associated with maternal BMI (β=0.37, p=0.001) but not with paternal BMI (β=0.12, p=0.26).
Correlation studies between children’s body mass index (BMI) z-score, parents’ BMI and snack energy and nutrient intake
In a model of linear regression adjusted for age, sex and nationality, no significant association has been found between snack energy intake and BMI z score (b= -0.04, p=0.7). In Table 1, we can observe that neither energy intake nor nutrient composition of snacks are different among the different categories of children’s BMI-z score.
Snack energy intake of children was found associated to maternal BMI (b = 0.36, p=0.01), but not to paternal BMI (b = -0.19, p=0.15); the model of linear regression was adjusted for age, nationality and education level.
Table 1. Snacking energy intake and nutrient composition in association with children’s BMI z score.
|
|
|
|
|
|
|
|
|
normal weight (n=55) |
overweight (n=28) |
obesity (n=12) |
||||
|
Energy intake by snack (kcal) |
194 (10,9) a |
196 (18,3) a |
185 (24,3) a |
|||
|
Energy from carbohydrates (%) |
62,1% (2,3) a |
60,4 %(4,0) a |
63,3 % (4,5) a |
|||
|
Energy from simple sugars (%) |
36,3% (3,2) a |
36,1% (5,6) a |
38,6 % (7,5) a |
|||
|
Energy from fat (%) |
28 % (1,9) a |
29,2 % (2,9) a |
28 % (7,5) a |
|||
|
Energy from saturated fatty acids (%) |
11,3 % (1,0) a |
13,2 % (1,7) a |
11,5 % (1,9) a |
|||
|
Energy from protein (%) |
|
8,6 % (0,8) a |
|
9,0 % (1,3) a |
|
10,1 % (2,2) a |
aNo significant difference was observed in relation to BMI Z score.
normal weight: (-2≤ z score BMI≤1); overweight (1≤z score BMI≤2); obesity (z score BMI>2).
In Table 2, the mothers’ sample was categorized in relation to BMI and we observed that snack energy intake of children with overweight or obese mothers (BMI ≥ 25 kg/m2) (n= 27) was significant higher than that of children with normal weight mothers (18.5≤BMI ≤ 24.9 kg/m2) (n=68) (239 ± 88 kcal vs 194 ± 69 kcal, p=0.01).
Table 2. Snacking energy intake and nutrient composition in relation to maternal body mass index (BMI).
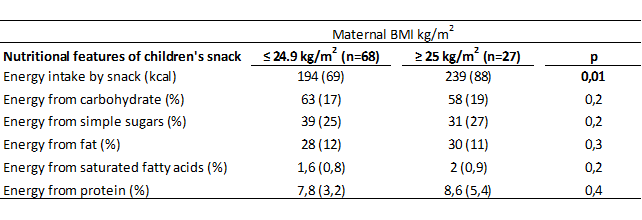
Data is expressed as mean (SD).
This study, carried out in a public elementary school of Milan (Italy), showed that snacking behavior in children aged 8-11 years is associated to maternal BMI. Overweight or obese mothers tend to give their children higher energy snacks than normal weight mothers do. In our sample, this association was not true for fathers. Similarly, we observed a direct association between children’s BMI-z score and maternal BMI but not between children’s BMI-z score and paternal BMI. These results support on the one hand a possible genetic impact of maternal nutritional status on that of the offspring; on the other hand, we cannot exclude a dominant role of women in family care and food education.
Even if we did not ask directly, the direct correlation found leads us to suppose that mothers had provided the snacks to their children or that the maternal model had affected children’s food choices. Although mothers have become increasingly engaged in work over the past 20 years, they are likely to spend significantly more time than fathers in direct interactions with their children across several family situations, including mealtimes, as Hale et al [19] also affirmed. Previous studies showed that parents play a pivotal role in the development of their child’s food preferences and energy intake, with research indicating that certain child feeding practices, such as exerting excessive control over what and how much children eat or the pressuring to eat more in general, may contribute to childhood overweight [6]. Actually, in this study, even if overweight or obese mothers provided higher energy snacks, this was not found to be directly associated with a greater BMI z score in the children. This result suggests that probably midmorning snacking is not a crucial meal in determining the children’s weight status. Considering the estimated energy requirement in children aged 8-11 years [11], in this study the energy intake derived from midmorning snacks was on average within 10% of daily energy intake as recommended, however the quality of snacks choices should be improved. In fact, 70% of the snacks collected were packaged snacks and sugary drinks, which are a major source of simple sugars. Consumption of nuts, fruits and vegetables was very low: a recent study conducted among adults showed that snacking energy from fruits and nuts was positively associated with diet quality and percent of snacking energy from vegetables was significantly associated with lower BMI [20], while percent of snacking energy from desserts, sweets and sugar-sweetened beverages were inversely associated with diet quality.
The prevalence of overweight and obesity in our sample was higher than that showed in the national epidemiological study of 2016 called “Okkio alla salute”, where obesity and overweight prevalence were respectively 9.3% and 21.3% [21]. Even if we did not find a direct association between snacking behaviors and impact on BMI z score, there are probably many factors, not investigated in this study, that have influenced the nutritional status of children, such as low physical activity and imbalanced dietary intakes in the other meals of the day.
We are aware of the several limits of this study: we only focused on a meal that normally contributes to total energy intake by no more than 10% and we know that it would have been useful to learn about the parents’ food habits and not just their weight status. However, we think that the innovative method used to collect information about habitual snacking behaviors is a strength. The pictures taken by teachers allowed us to collect the real portion size, kind and nutrient composition of snacks with more accuracy than a traditional dietary diary or the 24h recall. It is also worth considering that the association we found could be a solid and interesting result to take into account and to be investigated and confirmed in larger samples.
Findings from this observational study confirm a maternal role in child eating behavior during school age independent on the mother’s age, nationality or education level. This data encourages the need to develop food education programs involving families in the forefront, starting from mothers but also including fathers and all the other figures who take care of children after school, such as grandparents and babysitters. Finally, the great percent of foreign families found in this study represents a normal situation in public Italian schools as a consequence of recent immigration: further studies are necessary in order to program and test nutritional interventions that also take into account different cultural contexts.
We acknowledge and express our gratitude to Arianna Terzaghi, Deborah Ragolia, Giuseppe Marziani, Paola Zanotti, and Andrea Baratti for their support in data collection.
Funding :This research did not receive any specific grant from any funding agency in the public, commercial or non-profit sector.
Author’s Contributors: AS carried out the study design, collection and interpretation of data and drafted the manuscript. SB and AB participated to manuscript revision. All authors read and approved the final manuscript.
Orsi CM, Hale DE, Lynch JL (2011). Pediatric obesity epidemiology. Curr Opin Endocrinol Diabetes Obes 18 (1): 14-22 PMid:21157323
View Article PubMed/NCBIHughes AR, Sherriff A, Lawlor DA, Ness AR, Reilly JJ (2011). Incidence of obesity during childhood and adolescence in a large contemporary cohort. Prev Med 52, 300–304. PMid:21371500 PMCid:PMC3919170
View Article PubMed/NCBIFryar CD, Carroll MD, Ogden CL. Prevalence of Obesity among Children and Adolescents: United States, Trends 1963–1965 through 2009–2010. 2012.
Istituto Superiore di Sanità. Il Sistema di sorveglianza OKkio alla SALUTE: risultati 2014. A cura di Paola Nardone, Angela Spinelli, Marta Buoncristiano, Laura Lauria, Enrica Pizzi, Silvia Andreozzi e Daniela Galeone. 2016
Skelton JA, Irby MB, Grzywacz JG, Miller G (2011). Etiologies of obesity in children: nature and nurture. Pediatr Clin North Am 58 (6): 1333-1354 PMid:22093854 PMCid:PMC3224976
View Article PubMed/NCBIScaglioni S, Salvioni M and Galimberti C (2008). Influence of parental attitudes in the development of children eating behavior. BJN 99, Suppl. 1, S22–S25 PMid:18257948
View Article PubMed/NCBIBerg C, lappas G, Wolk A, et al (2009). Eating patterns and portion size associated with obesity in a Swedish population. Appetite 52 (1): 21-26 PMid:18694791
View Article PubMed/NCBIKant AK, Schatzkin A, Graubard BI, Ballard-Barbash R (1995). Frequency of eating occasions and weight change in the NHANES I Epidemiologic Follow up Study. Int J Obes Relat Metab Disord. 19 (7):468-474 PMid:8520636
PubMed/NCBIFabry P, Hejl Z, Fodor J, Braun T, Zvolankova K (1964). The frequency of meals. Its relation to overweight, hypercholesterolaemia, and decreased glucose tolerance. Lancet 2 (7360): 614-615 90510-0
View ArticleFabry P, Hejda S, Cerny K, Osancovà K, Pechar J (1966). Effect of meal frequency in schoolchildren. Changes in weight-height proportion and skinfold thickness. Am J Clin Nutr. 18 (5): 358-361
View ArticleSocietà Italiana di Nutrizione Umana. LARN 2014. Available from:
View ArticleKirk TR (2000). Role of dietary carbohydrate and frequent eating in body weight control. Proc Nutr Soc. 59 (3):349-358 PMid:10997651
View Article PubMed/NCBIPaddon-Jones D1, Westman E, Mattes RD, Wolfe RR, Astrup A, Westerterp-Plantenga M (2008). Protein, weight management, and satiety. Am J Clin Nutr. 87(5):1558S–1561S PMid:18469287
View Article PubMed/NCBIHowarth NC, Saltzman E, Roberts SB (2001) Dietary fiber and weight regulation. Nutr Rev. 59(5):129–139
View ArticleRolls BJ, Drewnowski A, Ledikwe JH (2005) Changing the energy density of the diet as a strategy for weight management. J Am Diet Assoc. 105(5S):98–103. PMid:15867904
View Article PubMed/NCBIBurrows TL, Martin RJ, Collins CE (2010) A Systematic Review of the Validity of Dietary Assessment Methods in Children when Compared with the Method of Doubly Labeled Water. J Am Diet Assoc 110 (10): 1501-1510 PMid:20869489
View Article PubMed/NCBIInternational Society for the Advancement of Kinanthropometry (ISAK) (2001). International Standards for Anthropometric Assessment.
World Health organization. The WHO Child Growth Standards. 2018. Available from:
View ArticleMc Hale SM, Crouter AC, McGuire SA and Updegraff KA (1995). Congruence between mothers' and fathers' family relations and children's well being. Child dev 66, 116-128
View ArticleBarnes TL, French SA, Harnack LJ, Mitchell NR, Wolfson J (2015). Snacking Behaviors, Diet Quality, and Body Mass Index in a Community Sample of Working Adults. Journal of the Academy of Nutrition and Dietetics 115, 1117-1123 PMid:25769747 PMCid:PMC4484309
View Article PubMed/NCBIMinistero della Salute. Dati OKkio alla Salute 2016. Epicentro. Available from: .
View Article