Farzaneh Zanjanchi
Tel.: 989123816819
E-mail address: fzanjanchi@yahoo.com
© 2019 Sift Desk Journals. All Rights Reserved
VOLUME: 3 ISSUE: 2
Page No: 276-284
Farzaneh Zanjanchi
Tel.: 989123816819
E-mail address: fzanjanchi@yahoo.com
Farzaneh Zanjanchi *, Mahdieh Sadeghpour
Department of Chemistry, Takestan Branch, Islamic Azad University, Takestan, Iran
Goar S%c3%a1nchez-Sanz(goar.sanchez@ichec.ie)
Bryan M. Wong(bryan.wong@ucr.edu)
Enxian Yuan(exyuan@yzu.edu.cn)
Biljana B Arsi%c4%87(biljana.arsic@pmf.edu.rs)
Farzaneh Zanjanchi, Computational Study of the Effect of Physical Factors on the Halochromic Behavior of Azo Indicators Using Density Functional Theory(2019)Journal of Computational Chemistry & Molecular Modeling 3(2)p:276-284
Azo dyes are an important class of pH indicators, with some applications in novel sensors. In this paper, the authors present a theoretical study to elucidate the effect of physical factors on the halochromic behavior of the azo dyes The studied azo dyes are methyl red and methyl orange and the physical factors such as temperature, pressure, ionic strength of solvent and isotope type of constituent atoms are taken into account. The obtained values for tautomery equilibrium constant show that the azo form of the indicators is more stable than their hydrazone form. Therefore, in the studies related to the acid-base equilibrium of the indicators, only azo form is considered. In the meantime, pH change of color change of the indicators, ∆pH, with the physical factors in the acid-base equilibrium of the indicators is studied. Increased temperature causes pH of color change of indicators to decrease. This drop is approximately similar in various pressures. Increasing pressure at any temperature results the increase of pH of color change. The effect of pressure on ∆pH is lower under higher pressures and is not dependent on the indicator type. By decreasing the polarity of the solvent used, the pH of color change of the indicators increases. The use of isotopes of atoms produces the increase in the pH of color change of the indicator that its value depends on the type of atom and type of the indicator. The methodology in this work will be useful in future dye design and is applicable to other dye classes as well. These findings indicate the importance of physical factors on the halochromic behavior of dyes for further research the development of pH-sensitive sensors.
Keyword: DFT, Halochromic, Isotope, Pressure, pH indicator, Solvent, Temperature
In addition to their main use as colourant, dyes are increasingly used in other fields, such as photovoltaic cells, optical switches and light emitting diodes. Some dyes show chromic properties, meaning that their colour change depending on an external influence; such as thermochromism, photochromism and halochromism properties [1-8]. A halochromic material is a material which changes color, when pH changes occur. The pH indicators have this property. To this day, the halochromic behavior of many dyes (azo, sulfonphthaleine, phenolphthalein, phenolate, quinolone dyes and et al.) has been studied experimentally and theoretically, [1,9-14] but so far, and to the knowledge of the authors, the theoretical study of the effect of physical factors on the color change pH of the azo dyes has not been done. In this research, we focus on two types of azo dyes including methyl red and methyl orange. The azo dyes are widely used as pH indicator in acidic medium, besides, they are applied in many technical applications such as optical storage capacity, optical switching, non-linear optics and pH optical sensor [12,14-17]. Recently, azobenzene based chromophores with anchoring to single-walled carbon nanotubes or graphene surfaces have drawn attention for applications in color detectors and optoelectronics due to their ability to undergo the photon-induced isomerization that changes the molecular orientation and the electrical dipole moment of the chromophore and thus modifies the electrostatic potential on these devices [18-22]. On the other hand, such works can be devoted to realizing bioinspired detectors (e.g. the human eye) and to fabricate synthetic single-photon systems such as superconductor nanowire detectors and avalanche photodiodes [23].
This research aims at theoretical and computational studying of changes of pH indicators ranges by change of temperature, pressure, ionic strength of solvent, substituent groups and isotopic type of constituent atoms. The results of this research can be used in the design of favorable indicators and suitable and predictable conditions for implementation and synthesis of pH-sensitive polymers and sensory materials.
In this study, first, the structures of two types of indicators including methyl-red and methyl-orange, in forms of azo, hydrazone (acidic modes) and base (base mode) were mapped using GaussView program and then fully optimized in Gaussian 03 program package using B3LYP/6-31++G** level of theory [24]. The optimized molecular structures of indicators in various forms are displayed in Fig. 1. Vibrational frequency calculations were performed at the same level of theory on the optimized structures to ensure the stability of structures and to calculate thermodynamic quantities. In acidic form, substituent element of carboxyl in methyl-red and sulfonyl hydroxide in methyl-orange are protonated and in basic form, they are deprotonated. The hydrazone form is tautomer of the azo form in the acidic mode. The results of vibrational frequencies calculations indicate that all studied structures contain real vibrational frequencies or number of zero negative imaginary frequency (NIMAG=0).
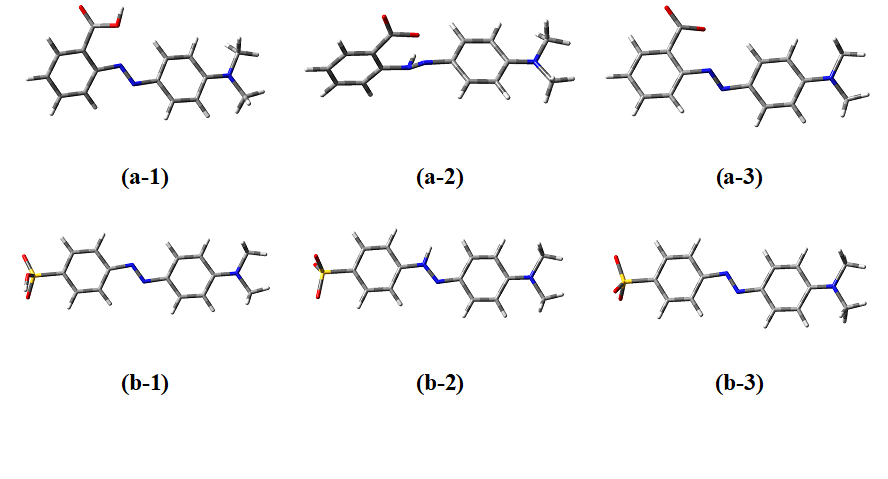
Fig. 1 The optimized molecular structures of a) methyl red and b) methyl orange indicators in the forms of 1) azo 2) hydrazone 3) base obtained at the B3LYP/6-31++G** level of theory
The purpose of this research is to investigate the effect of physical factors on pH range of color change of indicators; therefore, all thermodynamic studies were conducted under different conditions i.e. temperature, pressure, different solvents and change of the isotopic type of carbon, oxygen, hydrogen and nitrogen atoms of the studied indicators (12C → 13C, 16O → 18O, 1H → 2H and 14N → 15N).
In order to evaluate the relative stability of various acidic states of indicators, first, the following tautomeric equilibrium is discussed.

The thermodynamic quantities, ∆HT, ∆ST, ∆GT and KT for tautomeric equilibrium (1) are calculated as follows:
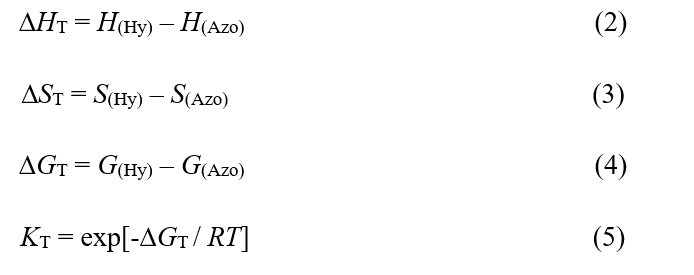
Where H is enthalpy, S is entropy, G is Gibbs free energy for each structure, ∆HT is enthalpy change, ∆ST is entropy change and ∆GT is Gibbs free energy change for the desired tautomeric equilibrium (Eq. 1) and KT is its equilibrium constant. All of the thermodynamic quantities are calculated at various temperature (273.15, 298.15 and 323.15 K), pressure (1, 5 and 10 atm), and solvents (water, ethanol and benzene) and are reported in Table 1 and Table 2.
Table 1. Thermodynamic quantities ∆HT, T∆ST and ∆GT in kcal/mol and equilibrium constants for the azo-hydrazone tautomery equilibrium of methyl red and methyl orange, KT, in the phase gas and the different pressures and temperatures, respectively in K and atm obtained at the B3LYP/6-31++G** level of theory
|
|
methyl red |
|
methyl orange |
||||||||
|
P |
T |
|
∆HT |
T∆ST |
∆GT |
KT |
|
∆HT |
T∆ST |
∆GT |
KT |
|
1 |
273.15 |
|
32.497 |
-2.408 |
34.905 |
1.175´10-28 |
|
28.557 |
0.505 |
28.052 |
3.577´10-23 |
|
5 |
273.15 |
|
32.497 |
-2.404 |
34.901 |
1.183´10-28 |
|
28.557 |
0.411 |
28.416 |
3.008´10-23 |
|
10 |
273.15 |
|
32.497 |
-2.404 |
34.902 |
1.183´10-28 |
|
28.557 |
0.412 |
28.145 |
3.021´10-23 |
|
1 |
298.15 |
|
32.459 |
-2.668 |
35.127 |
1.177´10-26 |
|
28.525 |
0.429 |
28.097 |
2.527´10-21 |
|
5 |
298.15 |
|
32.458 |
-2.668 |
35.127 |
1.177´10-26 |
|
28.525 |
0.399 |
28.126 |
2.407´10-21 |
|
10 |
298.15 |
|
32.459 |
-2.668 |
35.127 |
1.177´10-26 |
|
28.525 |
0.418 |
28.107 |
2.486´10-21 |
|
1 |
323.15 |
|
32.424 |
-2.930 |
35.354 |
1.225´10-24 |
|
28.493 |
0.418 |
28.075 |
1.025´10-19 |
|
5 |
323.15 |
|
32.423 |
-2.927 |
35.350 |
1.225´10-24 |
|
28.493 |
0.431 |
28.062 |
1.047´10-19 |
|
10 |
323.15 |
|
32.424 |
-2.930 |
35.354 |
1.225´10-24 |
|
28.493 |
0.450 |
28.043 |
1.079´10-19 |
Table 2. Thermodynamic quantities ∆HT, T∆ST and ∆GT in kcal/mol and equilibrium constants for the azo-hydrazone tautomery equilibrium of methyl red and methyl orange, KT, in the different solvents obtained at the B3LYP/6-31++G** level of theory.
|
|
methyl red |
|
methyl orange |
|||||||
|
solvent |
|
∆HT |
T∆ST |
∆GT |
KT |
|
∆HT |
T∆ST |
∆GT |
KT |
|
Benzene |
|
22.701 |
-0.447 |
23.148 |
1.073´10-17 |
|
11.678 |
0.893 |
10.785 |
1.241´10-8 |
|
Ethanol |
|
9.785 |
-0.388 |
10.173 |
3.400´10-8 |
|
5.621 |
0.448 |
5.173 |
1.613´10-4 |
|
Water |
|
8.707 |
-0.312 |
9.018 |
2.440´10-7 |
|
4.984 |
0.323 |
4.661 |
1.408´10-4 |
∆HT is positive for methyl-red and methyl-orange indicators under different conditions of temperature and pressure, and in the gas phase. Compared to methyl-orange, ∆HT values are larger for methyl-red. ∆HT decreases when temperature increases, which is obvious due to the endothermic process. ∆HT does not depend on pressure. ∆HT decrease considerably for the indicators in the solvated form. ∆ST is negative for methyl-red but positive for methyl-orange. Methyl-red ∆ST does not depend on pressure. As expected for intra-molecular processes, ∆ST values are very small for tautomeric equilibrium process, which is consistent with the experimental results reported by Gilli et al [25].
The results show that, in all cases, the azo form of methyl-red and methyl-orange indicators is more stable, compared to their hydrazone form. The difference in stability is greater for methyl-orange than for methyl-red (tautomeric equilibrium constant for methyl-orange is larger than for methyl-red).
In all cases, with increased temperature, ∆GT and KT increases. For each indicator, tautomeric equilibrium constant increases by about 100 times with the temperature increase to 25 K. Tautomeric equilibrium constant may either change slightly or remain stable with the pressure.
In this study, Conductor – like Polarizable Continuum Model (CPCM) is used to consider the effect of solvent. The method is derived from the Onsager Continuum Model and formulated by Tomasi et al. In the model, the solvent is considered as a continuous environment with a uniform dielectric constant, inside which the soluble remains as a spherical cavity. Molecule polarity can create bipolarity in environment, and the electric field created by solvent polarity can interact with the soluble molecule bipolarity, which results in system stability [26,27].
The obtained results from calculations in various solvents indicate that with increased solvent polarity (increase of dielectric constant of solvent), KT also increases. For example, tautomeric equilibrium constant of methyl red in water is 10 times the equilibrium constant in ethanol.
Generally, according to the results reported in Table 1 and Table 2, it is concluded that, compared to hydrazone form, the azo form is more stable for the studied indicators. Therefore, in the study of the equilibrium of acid and base states of the indicators, only azo form of acid state is considered.
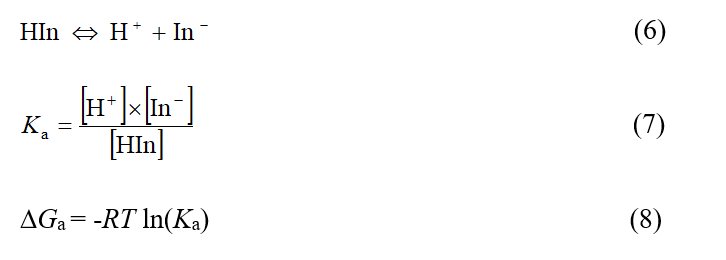
In the equilibrium reaction (Eq. 7), the equilibrium constant between acid and base states of indicators, Ka, and the relationship between equilibrium constant and Gibbs free energy change for the desired equilibrium, ∆Ga, are written as follows:
Enthalpy change, ∆Ha, entropy change, ∆Sa, Gibbs free energy change, ∆Ga, and equilibrium constant of ionization process of indicator, Ka, are calculated for the equilibrium reaction (Eq. 6) under different conditions and are reported in Tables 3, 4 and 5.
The reported results in Tables 3, 4 and 5 shows that ∆Ha is positive in all conditions, i.e. the ionization process of indicators is endothermic. As the temperature increases under constant pressure, ∆Ha increases, and (at constant temperature) under increasing pressure, it remains constant; that is, ∆Ha does not depend on pressure. Ionization processes of indicators are less endothermic in dissolved state (in water, ethanol and benzene solvents, compared to gas phase, ∆Ha contains less value). ∆Ha decreases with the increase of solvents polarity (in water, ∆Ha is less than ethanol, and in ethanol, it is less than benzene). ∆Ha increases with considering of isotopic effect of constituent atoms in all cases.
Table 3. Thermodynamic quantities ∆Ha, T∆Sa and ∆Ga in kcal/mol and equilibrium constants, Ka, for the indicators dissociation equilibrium of methyl red and methyl orange in the gas phase and the different pressures and temperatures, respectively in K and atm obtained at the B3LYP/6-31++G** level of theory
|
|
methyl red |
|
methyl orange |
||||||||
|
P |
T |
|
∆Ha |
T∆Sa |
∆Ga |
Ka |
|
∆Ha |
T∆Sa |
∆Ga |
Ka |
|
1 |
273.15 |
|
339.145 |
6.013 |
333.132 |
exp(-613.786) |
|
316.053 |
6.228 |
309.825 |
exp(-570.844) |
|
5 |
273.15 |
|
339.145 |
5.144 |
334.001 |
exp(-615.388) |
|
316.053 |
5.355 |
310.697 |
exp(-572.450) |
|
10 |
273.15 |
|
339.145 |
4.764 |
334.379 |
exp(-616.087) |
|
316.053 |
4.980 |
311.073 |
exp(-573.143) |
|
1 |
298.15 |
|
339.237 |
6.662 |
332.576 |
exp(-561.381) |
|
316.115 |
6.864 |
309.250 |
exp(-522.009) |
|
5 |
298.15 |
|
339.237 |
5.707 |
333.531 |
exp(-562.990) |
|
316.115 |
5.911 |
310.204 |
exp(-523.618) |
|
10 |
298.15 |
|
339.237 |
5.297 |
333.940 |
exp(-563.687) |
|
316.115 |
5.500 |
310.615 |
exp(-524.312) |
|
1 |
323.15 |
|
339.327 |
7.312 |
332.016 |
exp(-517.078) |
|
316.175 |
7.503 |
308.673 |
exp(-480.725) |
|
5 |
323.15 |
|
339.327 |
6.279 |
333.049 |
exp(-518.686) |
|
316.175 |
6.469 |
309.707 |
exp(-482.355) |
|
10 |
323.15 |
|
339.327 |
5.835 |
333.493 |
exp(-519.377) |
|
316.175 |
6.024 |
310.150 |
exp(-483.003) |
Table 4. Thermodynamic quantities ∆Ha, T∆Sa and ∆Ga in kcal/mol and equilibrium constants, Ka, for the indicators dissociation equilibrium of methyl red and methyl orange in the different solvents obtained at the B3LYP/6-31++G** level of theory
|
|
methyl red |
|
methyl orange |
|||||||
|
solvent |
|
∆Ha |
T∆Sa |
∆Ga |
Ka |
|
∆Ha |
T∆Sa |
∆Ga |
Ka |
|
Benzene |
|
250.095 |
7.459 |
242.635 |
exp(-409.862) |
|
230.275 |
7.300 |
222.972 |
exp(-376.378) |
|
Ethanol |
|
183.095 |
8.627 |
174.577 |
exp(-294.682) |
|
166.267 |
8.845 |
157.422 |
exp(-265.726) |
|
Water |
|
178.449 |
8.489 |
169.959 |
exp(-286.889) |
|
161.760 |
8.758 |
152.999 |
exp(-258.260) |
Table 5. Thermodynamic quantities ∆Ha, T∆Sa and ∆Ga in kcal/mol and equilibrium constants, Ka, for the indicators dissociation equilibrium of methyl red and methyl orange with change of isotopic type of constituent atoms obtained at the B3LYP/6-31++G** level of theory
|
|
methyl red |
|
methyl orange |
|||||||
|
Isotope |
|
∆Ha |
T∆Sa |
∆Ga |
Ka |
|
∆Ha |
T∆Sa |
∆Ga |
Ka |
|
13C |
|
339.259 |
6.664 |
332.595 |
exp(-561.414) |
|
317.908 |
6.413 |
311.494 |
exp(-525.796) |
|
18O |
|
339.254 |
6.658 |
332.595 |
exp(-561.414) |
|
316.493 |
6.609 |
309.884 |
exp(-523.078) |
|
2H |
|
341.447 |
7.075 |
334.373 |
exp(-564.415) |
|
318.438 |
7.174 |
311.264 |
exp(-525.407) |
|
15N |
|
339.238 |
6.660 |
332.578 |
exp(-572.627) |
|
316.245 |
6.834 |
309.410 |
exp(-522.278) |
T∆Sa is positive in all studied conditions. Considering the fact that the number of process components in products is higher than raw materials, such conclusion is logical and correct. T∆Sa increases at higher temperature under constant pressure and it decreases at constant temperature under higher pressure.
∆Ga is positive in all conditions, i.e. ionization process of indicators is non-spontaneous. Results show that ∆Ga decreases with increasing temperature under constant pressure and it increases with increasing pressure at constant temperature. Therefore, it is concluded that high temperature and low-pressure conditions are favorable for the reaction. Comparison of ∆Ga values with ∆Ha and T∆Sa values indicate that acid ionization of indicators is controlled by entropy agent (entropy of the process) and ∆Ga values in solvents phase are much smaller than in gas phase (in view of the interactions of soluble and solvent in the CPCM model, the species become more stable, especially the pregnant species). So, it is expected in the real and experimental conditions; ∆Ga values will be smaller. As a result, high-polarity solvents are another favorable condition for ionization process of indicators. ∆Ga increases with isotopic change of the constituent atoms of the indicator.
Due to the stability of acid mode, compared to base, Ka values are very small in all conditions. The obtained results indicate that ionization equilibrium constant was larger at high temperature and low-pressure conditions and in the solution phase, especially in the polar solvents. The isotopic effect decreased Ka values in all cases.
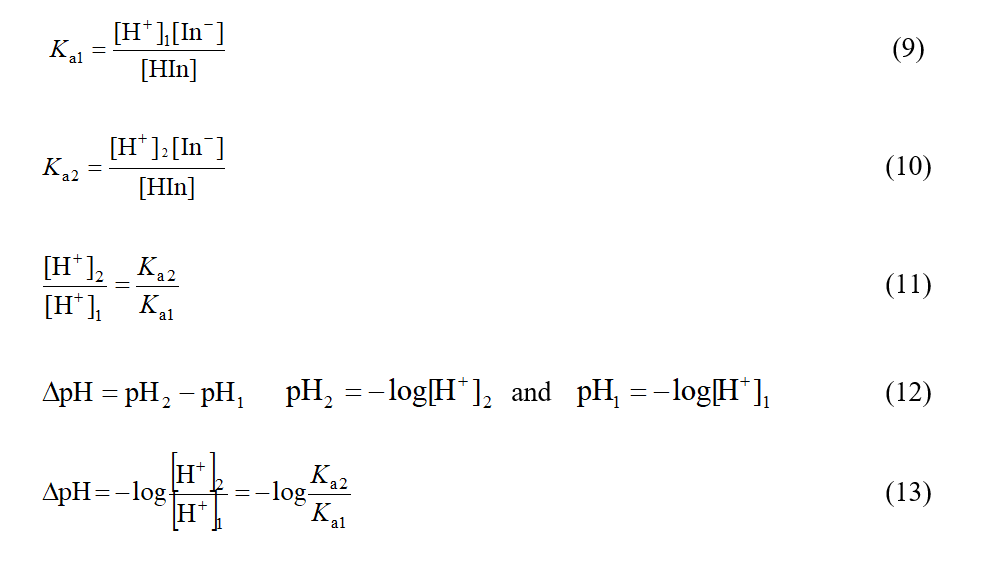
To investigate the changes in pH range of color change of indicators, resulted from different physical factors (temperature, pressure, solvent and isotopic), it is assumed that the concentration ratio of [In-]/[HIn] is constant (the ratio of [In-]/[HIn] is limit ratio of the required concentrations for observation of color change of indicators.) and [H+] concentration changes in different conditions proportional to Ka. Regarding the relationship between pH and [H+] concentration, changes in pH range of color change, ∆pH, can be calculated based on the following relationships:
The results reported in Table 6 show that, the increase of pressure from 1 atm to 5 atm for both types of indicators at any temperature, increased the pH of color change to 0.7, and the increase of pressure from 5 atm to 10 atm, increased the pH of color change to 0.3 and shows that the effect of pressure on ∆pH is low under high pressures and is not dependent on the indicator type.
Table 6. The changes in pH of color change of indicators in the gas phase resulted from change of pressure obtained at the different temperatures and the B3LYP/6-31++G** level of theory
|
∆pH |
methyl red |
|
methyl orange |
||||
|
273.15 K |
298.15 K |
323.15 K |
|
273.15 K |
298.15 K |
323.15 K |
|
|
1 atm → 5 atm |
0.696 |
0.698 |
0.698 |
|
0.698 |
0.699 |
0.699 |
|
5 atm → 10 atm |
0.303 |
0.300 |
0.300 |
|
0.301 |
0.301 |
0.301 |
The results obtained in Table 7 show that the increase of temperature decrease the pH of color change of indicators. This drop is approximately similar at various pressures. For methyl-red and methyl-orange indicators, the temperature change of 273.15 K -> 298.15 K was -22.8 and -21.2, respectively, and for 298.15 K -> 323.15 K, it was -19.2 and -17.9, respectively.
Table 7. The changes in pH of color change of indicators in the gas phase resulted from change of temperature obtained at the different pressures and the B3LYP/6-31++G** level of theory
|
∆pH |
methyl red |
|
methyl orange |
||||
|
1 atm |
5 atm |
10 atm |
|
1 atm |
5 atm |
10 atm |
|
|
273.15 K→ 298.15 K |
-22.759 |
-22.756 |
-22.760 |
|
-21.209 |
-21.207 |
-21.207 |
|
298.15 K→ 323.15 K |
-19.241 |
-19.241 |
-19.242 |
|
-17.929 |
-17.907 |
-17.928 |
Considering of the indicators in the solvents, the results are more consistent with experimental samples. The results reported in Table 8 show that, changing the solvent from water to ethanol, pH of color change of indicators varies by 3.4 for methyl-red and by 3.2 for methyl-orange, and, changing the solvent from ethanol to benzene, the change increases to about 50 and 48.
Table 8. The changes in pH of color change of indicators in the solution resulted from change of solvent obtained at the B3LYP/6-31++G** level of theory
|
∆pH |
methyl red |
|
methyl orange |
|
Ethanol → Benzene |
50.022 |
|
48.056 |
|
Water → Ethanol |
3.384 |
|
3.242 |
The results reported in Table 9 show that use of isotopes produced the increase in the pH of color change of the indicators that their values depend on the type of atom and type of the indicator.
Table 9. The changes in pH of color change of indicators in the gas phase resulted from change of isotopic type of constituent atoms obtained at the B3LYP/6-31++G** level of theory
|
∆pH |
methyl red |
|
methyl orange |
|
12C → 13C |
0.014 |
|
1.645 |
|
16O → 18O |
0.014 |
|
0.464 |
|
1H → 2H |
1.318 |
|
1.476 |
|
14N → 15N |
4.884 |
|
0.117 |
Initially, the structures of two types of azo indicators including methyl-red and methyl-orange, in the states of acidic (azo and hydrazone forms) and base were optimized in Gaussian 03 program package using B3LYP/6-31++G** level of theory.
Vibrational frequency calculations were performed on optimized structures to ensure the stability of structures and to calculate thermodynamic values. The results from vibrational frequency calculations show that all the studied structures have real vibration frequencies or zero NIMAG.
The computational results on the tautomeric equlibrium of the azo and the hydrazone forms of the indicators indicate that ∆HT in the gas phase is positive for the indicators under different temperature and pressure conditions. ∆HT values for methyl-red are larger than for methyl-orange. ∆HT decreases with increasing temperature and it does not depend on pressure. ∆ST is negative for methyl-red and positive for methyl-orange. Methyl-red ∆ST is not dependent on pressure. In all cases, and KT increase with increase of the temperature. With increased solvent polarity (increase of solvent dielectric constant), and KT also decrease and increase, respectively.
The results show that, in all cases, the azo form of the indicators is more stable than their hydrazone. This stability difference is greater for methyl-orange, compared to methyl-red. Therefore, in the study and calculations of the acid-base equilibrium of the indicators, only azo form is considered. In all cases, ∆Ha has a positive value. It increases with increased temperature under stable pressure, and at constant temperature conditions, with increasing pressure, it stays constant; that is, it does not depend on pressure. ∆Ha decreases with increasing solvent polarity (its value is less in water than in ethanol and less in ethanol than in benzene). ∆Ha increases with change of isotope type of constituent atoms of the indicators. T∆Sa values are positive in all studied conditions. They increase with increasing temperature under constant pressure conditions and decrease with increasing pressure at constant temperature. ∆Ga values are positive for all cases. The results show that ∆Ga values decrease with increasing temperature under constant pressure and increase with increasing pressure at constant temperature. Therefore, it is concluded that high temperature and low-pressure conditions are favorable for the reaction. The isotope effect increases ∆Ga values. Due to the stability of acidic forms compared to base forms, Ka values are very small in all conditions. The obtained values indicate that the equilibrium constant of ionization is higher in the conditions of high temperatures, low pressures, polar environment and non-use of isotopes of constructive atoms.
Increased temperature causes pH of color change of indicators to decrease. This drop is approximately similar in various pressures and, for methyl-red and methyl-orange indicators, at the change in temperature from 273.15 K ® 298.15 K, it is -22.8 and -21.2 , respectively, and at a change in temperature from 298.15 K ® 323.15 K, it is -19.2 and -17.9. Increasing pressure from 1 atm ®5 atm at any temperature for both types of indicators results in the increase of pH of color change by 0.7 and from 5 atm ®10 atm it results in the increase of pH of color change by 0.3; that is, the effect of pressure on ∆pH is lower under higher pressures and is not dependent on the indicator type. By changing the solvent from water to ethanol, pH of color change of indicators, ∆pH, varies by 3.4 for methyl-red and by 3.2 for methyl-orange, and by changing the ethanol to benzene, its value increases by about 50 and 48. The use of isotopes produce the increase in the pH of color change of the indicators that their value depend on the type of atom and type of the indicator.
The results of this research can help and guide the identification of favorable indicators, to predict pH of their color change in different conditions. Also, these results can act as the basis for future research on the interaction of dye molecules and polymers used on fabric base. For example, using halochromic properties in the color of polymers or textiles can produce sensory materials. These textile sensors are used in the production of wound dressing. They maintain all the features of the texture, are flexible and can be used on large surfaces, and can communicate warning messages by a color change at a particular point.
T. De Meyer, K. Hemelsoet, V. Van Speybroeck, K. De Clerck, Dyes Pigm. 2014, 102, 241.
View ArticleH. Zollinger, Color chemistry: synthesis, properties, and applications of organic dyes and pigments. VHCA en WILEY-VCH, 2003.
S. Kim, Functional dyes. Elsevier, 2006.
P. Bamfield, Chromic phenomena, technological applications of colour chemistry, Royal Society of Chemistry, 2001.
M. Domínguez, M. Caroli Rezende, J. Iran. Chem. Soc. 2010, 7, 995.
View ArticleS.N. Kovalenko, V.P. Chuev, V.M. Nikitchenko, M.M. Asimov, Theor. Exp. Chem. 1990, 26, 264.
View ArticleA.V. Kulinich, A.A. Ishchenko, S.L. Bondarev, Theor. Exp. Chem. 2018, 54, 331.
View ArticleV.A. Barachevskii, O.I. Kobeleva, T.M. Valova, Theor. Exp. Chem. 2012, 48, 12.
View ArticleL.Van der Schueren, K. Hemelsoet, V.Van Speybroeck, K.De Clerck, Dyes Pigm. 2012, 94, 443.
View ArticleT. De Meyer, I. Steyaert, K. Hemelsoet, R. Hoogenboom, V. Van Speybroeck, K. De Clerck, Dyes Pigm. 2016, 124, 249.
View ArticleL. Zhang, Z. Li, R. Chang, Y. Chen, W. Zhang, React. Funct. Polym. 2009, 69, 234.
View ArticleM. Hosseini, R. Heydari, M. Alimoradi, Spectrochim. Acta A 2014, 128, 864. PMid:24709351
View Article PubMed/NCBIL. Hermosilla, M. Caroli Rezende, V. Gageiro Machado, R.I. Stock, Spectrochim. Acta A 2017, 173, 556. PMid:27780125
View Article PubMed/NCBIA. Ghanadzadeh Gilani, V. Taghvaei, E. Moradi Rufchahi, M. Mirzaei, Spectrochim. Acta A 2017, 185, 111. PMid:28551448
View Article PubMed/NCBIM. Rosaria Plutino, E. Guido, C. Colleoni, G. Rosace, Sens. Actuators B 2017, 238, 281.
View ArticleJ. Griffiths, R. Cox, Dyes Pigm. 2000, 47, 65. 00064-4
View ArticleY. Zilberman, S. Kabiri Ameri, S.R. Sonkusale, Sens. Actuators B 2014, 194, 404.
View ArticleX. Zhou, T. Zifer, B.M. Wong, K.L. Krafcik, F. Léonard, A.L. Vance, Nano Lett. 2009, 9,1028 PMid:19206226
View Article PubMed/NCBIC. Huang, R.K. Wang, B.M. Wong, D.J. McGee, F. Léonard, Y. Jun Kim, K.F. Johnson, M. S. Arnold, M.A. Eriksson, P. Gopalan, ACS Nano 2011, 5, 7767. PMid:21919456
View Article PubMed/NCBIY. Zhao, C. Huang, M. Kim, B.M. Wong, F. Léonard, P. Gopalan, M.A. Eriksson, ACS Appl. Mater. Interfaces 2013, 2, 9355. PMid:24060382
View Article PubMed/NCBIC. Huang, M. Kim, B.M. Wong, N.S. Safron, M.S. Arnold, P. Gopalan, J. Phys. Chem. C 2014, 118, 2077.
View ArticleP.S. Johnson, C. Huang, M. Kim, N.S. Safron, M.S. Arnold, B.M. Wong, P. Gopalan, F.J. Himpsel, Langmuir 2014, 30, 2559. PMid:24520997
View Article PubMed/NCBIF. Léonard, M.E. Foster, C.D. Spataru, Sci. Rep. 2019, 9, 3268. PMid:30824712
View Article PubMed/NCBIM.J. Frisch, G.W. Trucks, H.B. Schlegel, G.E. Scuseria, M.A. Robb, J.R. Cheeseman, J.A. Montgomery Jr., T. Vreven, K.N. Kudin, J.C. Burant, J.M. Millam, S.S. Iyengar, J. Tomasi, V. Barone, B. Mennucci, M. Cossi, G. Scalmani, N. Rega, G.A. Petersson, H. Nakatsuji, M. Hada, M. Ehara, K. Toyota, R. Fukuda, J. Hasegawa, M. Ishida, T. Nakajima, Y. Honda, O. Kitao, H. Nakai, M. Klene, X. Li, J.E. Knox, H.P. Hratchian, J.B. Cross, V. Bakken, C. Adamo, J. Jaramillo, R. Gomperts, R.E. Stratmann, O. Yazyev, A.J. Austin, R. Cammi, C. Pomelli, J.W. Ochterski, P.Y. Ayala, K. Morokuma, G.A. Voth, P. Salvador, J.J. Dannenberg, V.G. Zakrzewski, S. Dapprich, A.D. Daniels, M.C. Strain, O. Farkas, D.K. Malick, A.D. Rabuck, K. Raghavachari, J.B. Foresman, J.V. Ortiz, Q. Cui, A.G. Baboul, S. Clifford, J. Cioslowski, B.B. Stefanov, G. Liu, A. Liashenko, P. Piskorz, I. Komaromi, R.L. Martin, D.J. Fox, T. Keith, M.A. Al-Laham, C.Y. Peng, A. Nanayakkara, M. Challacombe, P.M.W. Gill, B. Johnson, W. Chen, M.W. Wong, C. Gonzalez, J .A. Pople, Gaussian 03, Revision C.02, Gaussian Inc., Wallingford, CT, 2004.
P. Gilli, V. Bertolasi, L. Pretto, L. Antonov, G. Gilli, J. Am. Chem. Soc. 2005, 127, 4943. PMid:15796560
View Article PubMed/NCBIJ. Tomasi, M. Persico, Chem. Rev. 1994, 94, 2027.
View ArticleM. Cossi, N. Rega, G. Scalmani, V. Barone, J. Comput. Chem. 2003, 24, 669. PMid:12666158
View Article PubMed/NCBI