Abderahim Ahmadou
e-mail: abderahim.ahmadou@cirad.fr
ORCID of the author: 0000-0002-9130-0767
© 2019 Sift Desk Journals. All Rights Reserved
VOLUME: 4 ISSUE: 7
Page No: 877-888
Abderahim Ahmadou
e-mail: abderahim.ahmadou@cirad.fr
ORCID of the author: 0000-0002-9130-0767
Abderahim Ahmadou 1,2,4, Nicolas Brun 5, Alfredo Napoli 3, Noel Durand 1,2, Didier Montet1,2
Miao Du(dumiao@zzuli.edu.cn)
Jun Fu(fujun@edcmep.org.cn)
Zhihua Chen(chenzhihua@htu.edu.cn)
Abderahim Ahmadou, Nicolas Brun, Alfredo Napoli, Noel Durand, Didier Montet, Effect of pyrolysis temperature on ochratoxin A adsorption mechanisms and kinetics by cashew nut shell biochars (2019)Journal of Food Science & Technology 4(7) p:877-888
Biochars were produced from cashew nut shell at 400, 600 and 800°C. Production temperature significantly affected biochar properties and consequently the adsorption mechanisms of ochratoxin A. Biochars produced at higher temperatures had significantly higher specific surface areas, resulting in higher OTA adsorption capacities.
The isotherms and kinetics of the adsorption were used to identify the adsorption mechanisms. For the kinetics study, experiments were carried out after adjustment of the parameters influencing the system, such as pH, biochar quantity and OTA initial concentration. Experimental results were modelled according to isotherm equations representing Langmuir model and Freundlich model. Langmuir model matched best with the experimental data. The chemical surface reaction was fitted to a pseudo-second order equation, with very high regression coefficients.
Key words: Biochar, Adsorption, Ochratoxin A, Isotherms, Kinetics
Mycotoxins are low molecular weight secondary metabolites produced by filamentous fungi that have adverse effects at low levels on humans and animals. They have a significant impact on economies and international trade. Fungi producing mycotoxins are known as mycotoxigenic. Some of them are capable of producing more than one mycotoxin and some mycotoxins are produced by more than one fungal species. [1]
They appear in the feed chain because of fungal infection of crops, and due to the use of mouldy grains and forage as components of animal feed. Fungi can invade and produce mycotoxins on the growing plants before harvesting (pre-harvest toxins) or produce toxins after harvest and during crop storage and transportation (postharvest toxins). In general, environmental conditions, such as high temperatures, high moisture levels, and insect damage, cause stress and predispose plants in the field to mould growth and mycotoxin contamination [2]. Moreover, poor harvesting practices, improper drying, handling, packaging, and transport conditions contribute to increase the risk of mycotoxin production [3].
In recent years, mycotoxin contamination of cereal grains and animal feeds has evoked global concern for potential health risk on humans and animals. So far, more than 300 mycotoxins have been identified worldwide. [4]. Ochratoxin A (OCHRA) is produced by several fungi of Penicillium and Aspergillus genera, primarily by P. verrucosum, A. ochraceus and A. carbonarius. It is a potent nephrotoxin and has been associated with fatal human kidney disease. This compound is also genotoxic and teratogenic and has been classified as a possible human carcinogen [5].
The economic consequences of mycotoxin contamination are very significant, and often crops with large amounts of mycotoxin have to be destroyed. The most susceptible crops to contamination with mycotoxins are cereals such as wheat, maize, barley, rye and oat [6], [7], [8]
Utilization of adsorbents in animal diets is the most applied way of protecting animals against the harmful effects of mycotoxins present in animal feed. Most studies related to the prevention of mycotoxicosis by the utilization of adsorbents are focused on aluminosilicates, mainly zeolites (clinoptilolite) and bentonites (montmorillonite) [9], [10].
Different strategies, including preventive pre- and postharvest measures, have been developed to neutralize mycotoxins in animal feed such as good agricultural practices (GAP) and good storage practices (GSP). These actions are considered the best way of controlling mycotoxin contamination; however, even exercising of good practices might not completely avoid or eliminate mycotoxins in the feed chain [11]. Moreover, the use of physical and chemical methods for the detoxification of agricultural commodities contaminated with mycotoxins is restricted due to the problems associated with safety issues, possible losses in nutritional quality coupled with limited efficacy and cost implications [12].
As mycotoxins cause serious diseases in farm animals, the EU approved the use of mycotoxin-detoxifying agents, by including a new group of feed additives defined as ‘substances that can suppress or reduce the absorption, promote the excretion of mycotoxins or modify their mode of action’ [11]. At the same time, the EFSA reported a review of mycotoxin-detoxifying agents used as feed additives that covered aspects such as mode of action, efficacy and feed/food safety. Since then, numerous studies have been published on the efficacy of the adsorbing agents [11], [13], [14], [15], [16], [17].
However, most studies still focus on the efficacy of adsorption of a specific compound as well as to classify mycotoxin adsorbing agents (minerals, organic and synthetic) for feed decontamination, focusing on adsorbents with the ability to bind to multiple mycotoxins, which are in great demand of animal feed producers, but are still little studied in scientific literature.
The goal of adding adsorbents to the feed of livestock and poultry is to alleviate harmful effects of mycotoxins by preventing their passage into the animal’s blood and organs via complex formation between adsorbents and mycotoxins [18].
Biochar is a carbon-rich substance produced by subjecting biomass to pyrolysis (i.e., in the absence of oxygen) [19], playing an important role in controlling transport and bioavailability of organic contaminants. Recently, biochar has drawn substantial attention as a promising adsorbent and an effective means of sequestering pesticide residues in soil [20], [21], [22] and thus biochar may help to reduce human risk to environmental pollutants [19]. However, the effectiveness of biochar for sequestering pesticides from contaminated soil varied in many aspects, e.g., depending on biochar properties, soil properties, and environmental factors [23]. Biochar properties can vary dramatically depending on both the temperature and biomass source used for its production, and the properties can substantially impact the capacity to absorb pesticides [24], [25].
The objective of this research was to study the effect of production temperature on ochratoxin A adsorption capacity by various biochars obtained from cashew nut shell produced in three pyrolysis conditions. Correlations between pyrolysis temperature on biochar properties and its OTA adsorption capacity were estimated.
2.1. Biomass
The cashew nut shell is a co-product resulting from kernel extraction activity. It was purchased from "Agribusiness Mali" located in Bamako, Mali and conditioned in a room at 20°C and at a hygrometry of 66 % HR for more than 72 h in order to have a homogeneous biomass; its moisture and elemental composition was measured before pyrolysis. Biomass (cashew nut shell) was pyrolyzed without prior grinding.
2.2. Biochar production technology
Pyrolysis experiments were conducted in a horizontal fixed-bed tubular reactor (Fig. 1) in which the temperature was controlled using a PID controller as described by Bordoloi et al. (2015) [26]. Twenty g of biomass samples were placed into the reactor at ambient temperature. The heating rate of the reactor was 5°C per min to rise the selected peak pyrolysis temperature of 400, 600, 800°C, under constant flow rate of nitrogen at 30 L/min. Residence time into the reactor was fixed at 1 h after reaching the peak temperature. The cooling step of biochar was done by natural convection.
Mass yield of biochar was calculated using the following equation [27]:
Mass yield (%) = Wf/Wo X 100
Where, Wf is the mass (g) of the dry biochars and Wo is the mass (g) of the dry biomass.
2.3. Biochar characterization
Before any analysis and tests, the different biochars were ground and sieved at 200 µm.
Moisture and ash contents analysis were done by heating the samples in oven air at 105°C for 24 h and to 710 ± 10°C for 2 h, respectively, and weighing the residue.
Volatiles analyses were done by heating the samples without air to 900°C for 7 min using Nabertherm oven.
The total content of C, N and H were determined using a dry combustion method using Variomacrocube CHN analyzer. The O + S content was determined by subtracting the ash and C, N and H contents from the total mass of the sample.
The pH of biochar was determined according to Novak et al. (2009) [28] and Cheng and Lehmann (2009) [29]. Two grams of biochar (ground and sieved at 200 µm) were shaken with 40 mL distilled water for 30 min. This suspension was allowed to stand for 10 min before measuring the pH with a pH electrode pH Lab (Mettler Toledo).
The Hitachi-S4800 was used for scanning electron microscope (SEM) to evaluate the morphology of the different biochars.
Carbon dioxide adsorption isotherms were recorded on a 3FLEX Physisorption instrument (Micromeritics) at 273 K between 0 and 1 atm (i.e. relative pressure between 0 and 0.028). The microporous specific surface areas of biochars were determined by applying the Langmuir model. Microporous volumes were determined at a relative pressure of c.a. 0.028.
2.4. Ochratoxin A adsorption
OTA adsorption onto the different biochars depended on biochar intrinsic properties, modalities, and contact duration between biochar and OTA. In this sense, different conditions have been studied (pH, mass effect, pyrolysis temperature effect) and contact time have been considered.
The three biochars produced at 400, 600 and 800°C were previously ground and sieved at 200 µm. The different conditions used are described below. Each test was performed in triplicate.
2.4.1. Preparation of water-methanol mixture containing mycotoxins
Generally, pH plays an important role during mycotoxins adsorption because animal feed additives firstly gather in stomach where the pH value is below 3.5 and then pass through the intestine where the pH value is 6.5. pH has also an important effect on soil quality and crops yield. pH of the soils varied according to the zones and range from acidic pH (5) to an alkaline pH (8.5). Soil pH can change the surface chemistry of the biochar in soil and thus affect the biochar adsorption capacity. Three different pH solutions were tested to measure the effect of pH on the adsorption of OTA by biochars.
To get an acidic pH, the pH of the water was decreased to 4.15 by using 1 M HCl solution. To get a basic pH, pH of water was increased to 9.05 by using 1 M NaOH solution.
A 50/50 water-methanol solution (w/w) was prepared to solubilize OTA standard until to obtain a concentration of 38ng/mL. The OTA standard was purchased from R-Biopharm France.
2.4.2 Effect of biochar production temperature on OTA adsorption
The pyrolysis temperature is an important parameter that plays on biochars physicochemical properties. Biochar production temperature effect on OTA adsorption was carried out by stirring 1000 mg of each biochar (400, 600 and 800°C) with 5 mL of the water/methanol solution (w/w) containing OTA at 38 ng / mL in a 50 mL falcon tube . The whole solution was stirred at 500 vibrations per min for 45 min.
After, 2 mL of each filtrate was collected and filtered with a syringe and then analyzed by HPLC to determine OTA residual concentrations.
2.4.3. Study of biochar mass effect on OTA adsorption
The tests were carried out by stirring 5 mL of the water-methanol solution (w/w) containing OTA at 38 ng / mL, with different masses (25, 100,175, 250, 500 and 1000 mg) of the three different biochars in a 50 mL falcon, under constant stirring of 500 vibrations / min, for 45 min at pH 6.54. After 2 mL of each filtrate was collected and filtered with a syringe and then analyzed by HPLC to determine OTA residual concentrations.
2.4.4. Study of pH effect on OTA adsorption
The pH of the water-methanol solution containing OTA at 38 ng / mL was adjusted to 4.15, 6.54 and 9.05 by using solutions of 1 M HCl or NaOH.
250 mg of each biochar was added in 5 mL water-methanol solution (w/w) containing 38 ng / mL OTA at pH 4.15, 6.54 and 9.54 in a 50 mL falcon, under constant agitation of 500 vibrations / min, for 45 min, then 2 mL of each filtrate was collected and filtered for HPLC analysis.
2.4.5. Study of contact-time effect on OTA adsorption
The contact-time effect on OTA adsorption by the different biochars tests were carried out by adding 250 mg of each biochar (400, 600 and 800°C.) in 5 mL of water-methanol solution (w/w) containing OTA at 38 ng / mL at pH 6.54 with constant stirring of 500 vibrations / min during 45 min. Samples were taken at different intervals time and final OTA concentration was determined by HPLC after filtration.
2.4.6. Study of OTA concentration effect on biochars
In order to build a sorption isotherm for each biochar, 250 mg of biochar was added to 5 mL water-methanol solution (w/w) containing different OTA concentrations (25, 35, 55, 75 and 100 ng/ mL) at pH 6.54 under constant stirring of 500 vibrations / min during 45 min. Samples were taken at different intervals time and after filtration the final OTA concentration was determined by HPLC.
Pseudo first order, pseudo second order are two of the most commonly used kinetics models to reveal the time-dependence of adsorption [30]. They were used to simulate the kinetics data:
qt = qe (1-e-k1t) (1)
qt = (k2 qe2t ) / (1 + k2qet) (2)
Where k1 (min−1) is the constant rate of pseudo first order adsorption, k2 (g/mg/min) is the pseudo second order constant rate.
In Eq. (2), qe (mg/g) is the equilibrium adsorption capacity, and qt (mg/g) in each equation is the adsorbed ochratoxin A at time t.
The equations were linearized to facilitate constants determination and the application results of these different models allowed us to identify the main step that leads OTA global adsorption mechanism of the different biochars.
2.5 Ochratoxin A analysis
OTA was quantified by HPLC using a fluorescence detector (Shimadzu RF 20A, Japan) [31]. The operating conditions were as follows: injection volume of 100 µL; C18 reverse-phase HPLC column, Uptisphere type, ODS, 5 µm particle size, 5 ODB, 250 x 4.6 mm, with identical pre-column, thermostatically controlled at 35°C; isocratic flow rate of 1 mL/min (mobile phase: methanol/water/acetic acid, 69/30/1); excitation wavelength of 333 nm and emission wavelength of 460 nm. The contents were calculated from a calibration curve established from an OTA standard (1 µg/mL; ref PD 226 R. Biopharm Rhône Ltd, Glasgow, UK).
3.1. Biochar characterization
The moisture content of the cashew nut shell after stabilization in climatic room was 5.35% at 20°C and the standard deviation was 0.28. Its Carbon, Hydrogen and Nitrogen contents were respectively 50.04, 3.89, and 0.42%.
As shown in Table 1, biochar yield decreased logically with increasing pyrolysis temperature. It may be due to the conversion of compounds such as cellulose, hemicellulose and lignin into carboneous products, water and CO2.
Biochar yield decreased from 25.02 % for the biochar produced at 400°C to 21.54 % for the biochar produced at 800°C (Table 1).
Ash content increased with the increase of temperatures from 8.85% at 400°C to 12.65% at 800°C (Table 1). This was due to the increase in the relative abundance of the minerals that were stable during carbonization [32].
The results of the proximate, ultimate analyses of the biochars are summarized in Table 1. They revealed that carbon content increased with pyrolysis temperature. The biochar produced at 800°C had a highest carbon content of 87.42% and Biochar produced at 400°C had the lowest carbon content (70.04%).
In contrast to carbon content, the volatile matters logically decreased with increasing pyrolysis temperatures from 400 to 800°C. Recovered volatiles were highest with 21.90% in biochar produced at 400°C and 10.22% for biochar produced at 800°C
Biochar solution pH varied from pH 10.61 (400°C) to pH 9.81 (800°C). Our biochars were thus strongly alkaline. Previous literature reported biochar pH values (without further processing of biochars) between pH 4 and pH 12, with typical values being above pH 7. Zhao et al. (2013) found biochar pH levels between 8.8 and 10.8, depending of biomass feedstock type.
Table 1. Properties of biochar at different temperatures
|
Sample |
Pyrolysis temperature (°C) |
Elemental composition
|
VM (%) |
FC |
Ash (%) |
pH |
Biochar yield (%) |
|||
|
Cashew Nut Shell |
400 |
|
21.90 |
69.85 |
8.25 |
10.61 |
25.02 |
|||
|
Cashew Nut Shell |
400 |
|
14.08 |
77.39 |
8.53 |
9.83 |
23.13 |
|||
|
Cashew Nut Shell |
400 |
|
10.22 |
77.13 |
12.65 |
9.81 |
21.54 |
VM: Volatile Matters
FC: Fixed Carbon

Fig.1. Scanning electron microscopy (SEM) images of biochars prepared from cashew nut shell at different magnification
(a) Raw cashew nut shell; (b) Biochar 400°C; (c) Biochar 600°C; (d) Biochar 800°C
The morphology of raw cashew nut shell and its biochar (after pyrolysis) are shown in Fig. 1. Scanning electron microscopy observation shows some differences in size and shape of the particles.
On the raw cashew nut shell is observed a coating which corresponds to the cashew nut shell liquid (CNSL) which is a major compound among the constituents of the cashew nut shell; but after pyrolysis, the images (b,c and d) show an absence of the CNSL, which is due to its thermal decomposition under heat effect. All biochars have different shapes and sizes with the presence of porosity and the particles have quite varied dimensions.
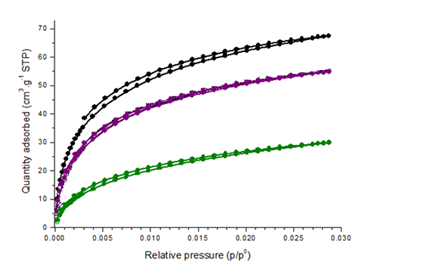
Fig.2. Influence of pyrolysis temperature on CO2 adsorption by different biochars
The Langmuir surface area of cashew nut shell biochars was strongly affected by production temperature. The specific surface area of biochar pyrolyzed at 400°C reaches 151 m2/g, climbs to 250 m2/g at 600°C and dramatically increases to 306 m2/g for the biochar produced at 800°C. The increased surface area suggests that micropores in biochar gradually developed with increased production temperature in 400–800°C, which was also observed in previous studies [33].
For the three biochars produced at 400, 600 and 800°C the micropore volumes are respectively 0.05, 0.09 and 0.11cm3/g (table 2).
The dramatic increase in surface area from 400°C to 800°C was due to the decomposition of lignin and quick release of H2 and CH4, which generates significant densities of micropores [34].
Table 2. Porous characteristics of biochars
|
|
Biochar 800°C |
Biochar 600°C |
Biochar 400°C |
|
BET surface area (m2/g) # |
306 |
250 |
151 |
|
Micropore volume (cm3/g) § |
0,11 |
0,09 |
0,05 |
#Langmuir theory; §Micropore volume determined at p/p0 0,028
3.2. OTA adsorption results
3.2.1. Biochar production temperature effect on OTA adsorption
With 1000 mg of each biochar in 5 mL of water-methanol solution (w/w) containing OTA at 38 ng / mL; we observed a difference in OTA adsorption rates which was mainly related to the increase in the pyrolysis temperature. The adsorption rates for the biochars produced at 400, 600 and 800°C were respectively as follows; 66.21%, 78.98% and 92.35%.
The increase of biochar production temperature allowed an increase in the OTA adsorption rate.
Among the effects of the increase of pyrolysis temperature on biochar properties; as mentioned above, we also obtained an increase of porosity; and the increase of the porosity can be a favorable parameter for molecules adsorption.
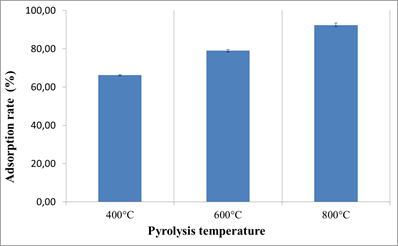
Fig.3. Production temperature effect on OTA adsorption on biochars
3.2.2. Biochar mass effect on OTA adsorption
The adsorption rates varied according biochar mass used; an increase in OTA adsorption rate was observed with the increase of biochar mass.
The adsorption rates vary with the type of biochar used (400,600 and 800°C). For the biochars produced at 400 and 800°C, the best adsorption rates are obtained with 500 mg, so it’s not necessary to add more biochar.
To avoid an ineffective overdose, it is therefore useful to work with biochar mass ≤ 500 mg.
To determine the adsorption capacities by saturating all the probable sites, we chose to work with 250 mg of biochar.
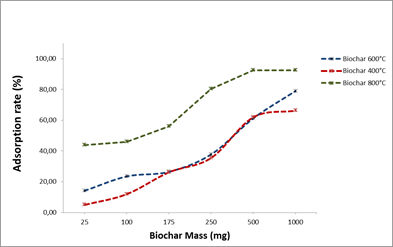
Fig.4. Biochar mass effect on OTA adsorption
3.2.3 pH effect on OTA adsorption
The tests were carried out at pH 4.15, 6.54 and 9.05 and the results showed a slight effect of the pH on OTA adsorption by the different biochars. The effect was mainly related to the biochar production temperatures. Biochars produced at 400 and 600°C appeared to be the most affected by the pH change. In general, the best adsorption rates for all biochars were obtained at pH 4.15 and pH 6.54.
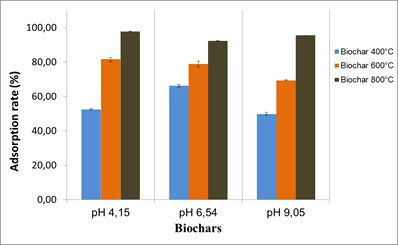
Fig.5. pH effect on OTA adsorption
3.2.4. Effect of contact-time on OTA adsorption
The observation of contact-time effect showed two different forms. The first was fast and was in the first 15 min, while the second was slow. They could express the equilibrium between biochar and OTA. The adsorption rates varied depending on the type of biochar used (400, 600 and 800°C).
Most of the OTA was adsorbed by the different biochars in the first 20 min and equilibrium was reached after 30 min of contact.
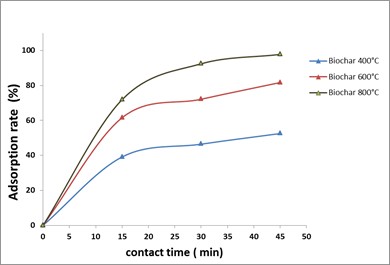
Fig.6. Effect of contact-time on OTA adsorption
3.3.5. Adsorption isotherms and kinetics
OTA adsorption at different concentrations (35, 55, 75 and 100 ng / mL) experimental data was fitted with the Langmuir and Freundlich isotherm models. It is assumed by Langmuir isotherm model that the adsorption process is monolayer, which means that no further adsorption occurred once adsorption took place on specific sites of the adsorbent. The relationship is expressed as follows:

Where qe is the equilibrium adsorption capacity (mg/g), Ce represents the equilibrium concentration in solution (mg/L), KL is the Langmuir constant (L/mg) and qm represents the maximum adsorption capacity of the adsorbent (mg/g). Experimental values of qm and KL are calculated from the slope and intercept of the linear plot of Ce/qe against Ce.
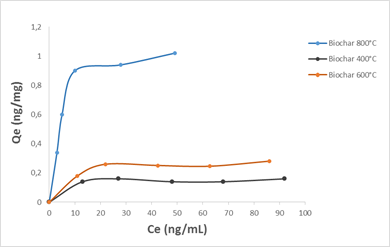
Fig.7. adsorption isotherms of OTA on cashew nut shell biochars (250 mg biochar in 5 mL solution of water-methanol solution (w/w))
On the other hand, the Freundlich model is an empirical expression, which assumed that a multilayer adsorption occurs on the heterogeneous surface or surface supporting sites of various affinities [35]. The equation is described as follows:

Where KF and 1/n are the Freundlich constants which represent the adsorption capacity and adsorption strength, respectively. The magnitude of 1/n quantifies the degree of heterogeneity of the adsorbent surface and the favorability of adsorption [36]. KF and n can be obtained from the intercept and slope of the linear plot of ln qe versus ln ce.
Table 3 presents the values of Langmuir and Freundlich constants, extrapolated from the equations of these two models. By adjusting the experimental points on both models, and based on the values of the R2 coefficient, it appears that the Langmuir one expresses better the adsorption type for all three biochars (R2 = 0.98). Thus, the OTA molecules could be adsorbed in monolayers, without interactions between them.
Table 3. Isotherm parameters for OTA adsorption on biochars issued from cashew nut shell
|
Adsorbent |
Langmuir model |
Freundlich model |
||||
|
|
Qmax (ng/mg) |
KL |
R2 |
K |
1/n |
R2 |
|
Biochar 400°C |
0.15 |
0.41 |
0.9826 |
0.75 |
0.042 |
0.8027 |
|
Biochar 600°C |
0.27 |
0.31 |
0.9883 |
0.75 |
0.028 |
0.5900 |
|
Biochar 800°C |
1.08 |
0.31 |
0.9868 |
0.60 |
0.10 |
0.2348 |
The favorable nature of the adsorption can be expressed in terms of a dimensionless constant called the separation factor or equilibrium parameter (RL), which is defined by:
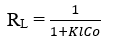
The RL values indicate the isothermal type as being irreversible (RL = 0), favorable (0 <RL <1), linear (RL = 1) or unfavorable (RL> 1)
The RL values are shown in Table 4:
Table 4. Values of the dimensionless separation factor or the equilibrium parameter
|
Initial concentration (ng / mL) |
RL- B400 |
RL- B600 |
RL- B800 |
|
35 |
0.063 |
0.083 |
0.084 |
|
55 |
0.041 |
0.054 |
0.041 |
|
75 |
0.030 |
0.040 |
0.031 |
|
100 |
0.023 |
0.030 |
0.031 |
B400 = Biochar 400°C, B600 = Biochar 600°C, B800 = Biochar 800°C
The values of RL for OTA adsorption on the three biochars (400,600 and 800°C) are less than 1 and very close to 0, which indicates a favorable adsorption (also the desorption tests have shown that OTA adsorption on biochars is irreversible).
Pseudo-first-order constants were determined by extrapolation of the Log (qe-qt) vs plot. t. The values of the adsorbed quantities qe, the pseudo-first order constants k1 and the regression coefficients R2 for the three biochars are given in Table 5. The values of R2 were found relatively low and between 0.5079 and 0, 9007. The calculation of qe for the three biochars shows that the amounts of OTA adsorbed are rather small compared to the experimental quantities. These observations lead us to say that the adsorption of the OTA did not follow the pseudo first order equation.
The application of the pseudo-second-order kinetics model to the results obtained for the OTA adsorption allowed us to calculate the values of the adsorbed quantities qe, the pseudo-second-order constants k2 and the regression coefficients R2 for the three biochars used and the results are given in Table 5. In view of these results, it appears that the equilibrium adsorbed quantity increased with the increase of biochar production temperature. On the other hand, the R2 values are very high and far exceed those obtained with the pseudo-first order model. The amounts fixed at equilibrium qe are 0.15, 0.23, 0.82 ng / mg respectively for the three biochars produced at 400, 600 and 800°C and are very close to the values found experimentally (Fig. 7).
These last two observations lead us to assume that the adsorption process follows the pseudo-second-order model. The plot of t/qt vs. t, for the three biochars, allowed to determine, by extrapolation, the constants of the pseudo-second order, at different contact times.
Table 5. Kinetics parameters for OTA adsorption by cashew nut shell biochars (250 mg of each biochar in 5 mL of water-methanol solution (w/w)) with OTA at different concentrations
|
Biochar |
Pseudo first order |
Pseudo second order |
||||||||||||||||||||||||
|
|
|
|
||||||||||||||||||||||||
|
400°C |
||||||||||||||||||||||||||
|
600°C |
||||||||||||||||||||||||||
|
800°C |
Desorption tests
The desorption study permitted to observe the detachment of OTA adsorbed on biochars. In order to evaluate the strength of OTA-Biochar bond, we applied two desorption tests.
For the first test we used 5 mL of water/methanol solution (w/w) in a 50 mL flask containing 250 mg of dried biochar having been in contact with OTA at 35 ng/mL under stirring for 45 min, then after 20 min of ultrasonic agitation the solution was filtered and analyzed by HPLC. In the second desorption test, the water-methanol solution was replaced by a 5 mL solution of 10 mM TRIS-EDTA with 20% methanol, which is a fairly well-known OTA elution buffer and after stirring for 45 min, followed by 20 min of ultrasonic agitation the solution was filtered and analyzed by HPLC.
The results obtained for all three biochars showed a desorption rate of 1% using water-methanol solution and a desorption rate of 4% with TRIS-EDTA, which shows the strength of OTA-biochar binding; after OTA adsorption on biochar it was not possible to separate it under the experimental conditions that were applied.
Biochars were produced from cashew nut shell at 400, 600 and 800°C. The influence of pyrolysis temperatures on the adsorption characteristics and mechanisms of ochratoxin A on cashew nut shell biochars were investigated. Biochars produced at higher temperatures have higher specific surface areas, resulting in higher OTA adsorption capacities and faster adsorption kinetics.
The Langmuir model better expresses the type of adsorption; OTA molecules are then adsorbed in monolayers on the biochar and the study of the influence of initial concentration on the kinetics has shown that the adsorption process follows the pseudo-second order model. The adsorption capacity of biochar mass increased with the increase of OTA initial concentration in the solution.
In vivo application or field-scale applications of cashew nut shell biochars for ochratoxin A adsorption in soil or animal feed is suggested for future research, to verify the laboratory findings of the present study.
Marin, S., Ramos, A.J., Cano-Sancho, C., Sanchis, V. " Mycotoxins: occurrence,toxicology, and assessment.," Food Chem. Toxicol , pp. 60, 218-237., 2013.
View ArticleMedina, A., Rodríguez, A., Sultan, Y., Magan, N. "Climate change factors and and Aspergillus flavus: effects on gene expression, growth and aflatoxin production.," World Mycotoxin J, pp. 8, 171-179., 2015.
View ArticleBhat, R., Rai, R.V., Karim, A.A "Mycotoxins in food and feed: present status and future concerns," Compr. Rev. Food Sci. Food Saf, pp. 9, 57-81., 2010.
View ArticleZhao, Z., Liu, N., Yang, L., Wang, J., Song, S., Nie, D., Yang, X., Hou, J., Wu, A " Crosslinked chitosan polymers as generic adsorbents for simultaneous adsorption of multiple mycotoxins," Food Control, pp. 57, 362-369., 2015.
View ArticleGolge, O., Kabak, B. "First report: exposure estimates to ochratoxin A through wheat bread and rice intake in Turkey," J. Cereal Sci., pp. 69, 213-217., 2016.
View ArticleCano-Sancho, G., Marin, S., Ramos, A.J., Sanchis, V. "Biomonitoring of Fusarium spp. mycotoxins: perspectives for an individual exposure assessment tool," Food Sci.Technol. , pp. 16, 266-276, 2010.
View ArticleRodríguez-Carrasco, Y., Ruiz, M.J., Font, G., Berrada, H., "Exposure estimates to Fusarium mycotoxins through cereals intake," Chemosphere , pp. 93, 2297-2303., 2013.
View ArticleVidal, A., Marín, S., Ramos, A.J., Cano-Sancho, G., Sanchis, V "Determination of aflatoxins, deoxynivalenol, ochratoxin A and zearalenone in wheat and oat based bran supplements sold in the Spanish market," Food Chem. Toxicol., pp. 53, 133-138., 2013.
View ArticleShawna, L., Lemke, S., Patrick, G., Grant, T., Timothy D., Phillips, J "Adsorption of Zearalenone by Organophilic Montmorillonite Clay," J. Agric. Food Chem., 1998, 46 (9), pp 3789-3796, pp. 46 (9), 3789-3796, 1998.
View ArticleLi, Z., Bowman.S.R "Sorption of Perchloroethylene by Surfactant-Modified Zeolite as Controlled by Surfactant Loading," Environ. Sci. Technol., pp. 32 (15), 2278-2282, 1998.
View ArticleDi Gregorio, M.C., de Neeff, D.V., Jager, A.V., Corassin, C.H., de Pinho Carão, A.C., de Albuquerque, R., de Azevedo, A.C., Fernandes Oliveira, C.A "Mineral adsorbent for prevention mycotoxins in animal feed. Toxin Rev. 33, 125-135.," Toxin Rev., pp. 33, 125-135., 2014.
View ArticleKolosova, A., Stroka, J "Substances for reduction of the contamination of feed by mycotoxins.," World Mycotoxin J., pp. 4, 225-256., 2011.
View ArticleMagnoli, A.P., Monge, M.P., Miazzo, R.D., Cavaglieri, L.R., Magnoli, C.E., Merkis, C.I.,Cristofolini, A.L., Dalcero, A.M., Chiacchiera, S.M "Effect of low levels ofaflatoxin B-1 on performance, biochemical parameters, and aflatoxin B1 in broiler liver tissues in the presence of monensin and sodium bentonite.," Poultry Sci. , pp. 90,48-58., 2011.
View ArticleNeeff, D.V., Ledoux, D.R., Rottinghaus, G.E., Bermudez, A.J., Dakovic, A., Murarolli, R.A., Oliveira, C.A.F "In vitro and in vivo efficacy of a hydrated sodium calcium aluminosilicate to bind and reduce aflatoxin residues in tissues of broiler chicks fed aflatoxin B1.," Poultry Sci., pp. 92, 131-137., 2013.
View ArticleNesic, K., Resanovic, R., Nesic, V., Sinovec, Z "Efficacy of mineral and organic adsorbent in alleviating harmful effects of zearalenone on pigs performance and health.," Acta Vet. Beograd. , pp. 58, 211-219., 2008.
View ArticleSantos, R.R., Vermeulen, S., Haritova, A., Fink-Gremmels, J "Isotherm modeling of organic activated bentonite and humic acid polymer used as mycotoxin adsorbents.," Food Addit. Contam. , pp. 28, 1578-1589., 2011.
View ArticleWang, J.P., Chi, F., Kim, I.H "Effects of montmorillonite clay on growth performance, nutrient digestibility, vulva size, faecal microflora, and oxidative stress in weaning gilts challenged with zearalenone," Anim. Feed Sci. Technol. , pp. 178, 158-166., 2012.
View ArticleJard, G., Liboz, T., Mathieu, F., Guyonvarc, A., Lebrihi, A "Review of mycotoxin reduction in food and feed: from prevention in the field to detoxification by adsorption or transformation," Food Addit. Contam., pp. 28, 1590-1609., 2011.
View ArticleAhmad, M., Rajapaksha, A.U., Lim, J.E., Zhang, M., Bolan, N., Mohan, D., Vithanage, M., Lee, S.S., Ok, Y.S "Biochar as a sorbent for contaminant management in soil and water: a review," Chemosphere, pp. 3, 19-33, 2014.
View ArticleZhang, X., Wang, H., He, L., Lu, K., Sarmah, A., J. Li, J "Using biochar for remediation of soils contaminated with heavy metals and organic pollutants," Environ. Sci. Pollut. Res., pp. 20-12, 8472-8483, 2013.
View ArticleBeesley, L., Marmiroli, M "The immobilisation and retention of soluble arsenic, cadmium and zinc by biochar," Environ. Pollut., , pp. 159, 474-480, 2011.
View ArticleSafaei, K.M., Zhang, Q., Lin, D., Zheng, Y., Fang, H., Yu, Y "Biochar: a Review of Its Impact on Pesticide Behavior in Soil Environments and Its Potential Applications," J. Envir. Sci, pp. 44, 269-279, 2016.
View ArticleQiu, Y., Xiao, X., Cheng, H., Zhou, Z., Sheng, G.D "Influence of environmental factors on pesticide adsorption by black carbon: pH and model dissolved organic matter," Environ. Sci.Technol. 43 (13) (2009), pp. 4973-4978, pp. 43, 4973-4978, 2009.
View ArticleWang, Z., Han, L., Sun, K., Jin, J., Ro, K.S., Libra, J.A "Sorption of four hydrophobic organic contaminants by biochars derived from maize straw, wood dust and swine manure at different pyrolytic temperatures," Chemosphere, pp. 144, 285-291, 2016.
View ArticleZhang, G.X., Zhang, Q., Sun, K., Liu, X.T., Zheng, W.J., Zhao.Y "Sorption of simazine to corn straw biochars prepared at different pyrolytic temperatures," Environ. Pollut., pp. 10, 159, 2011.
View ArticleBordoloi, N., Narzari, R., Chutia, R.S., Bhaskar, T., Kataki, R "Pyrolysis of Mesua and Pongamia glabraseed cover: characterization of bio-oil and its subfractions," Bioresour. Technol, p. 83-89, 2015.
View ArticleNiandou, M.A.S, Novak, J.M, Bansode, R.R, Yu J, Rehrah D, Ahmedna, M "Selection of pecan shell based activated carbons for removal of organic and inorganic impurities from water," J. Environ. Qual, p. 902-911, 2012.
View ArticleNovak, J.F, Busscher, W.J, Laird, D.L, Ahmedna, M, Watts, D.W, Niandou, M.A.S "Impact of biochar amendment on fertility of a Southeastern coastal plain soil," Soil Science , pp. 174, 105-112., 2009.
View ArticleCheng C.H., Lehmann, J "Ageing of black carbon along a temperature gradient," Chemosphere, pp. 75, 1021-1027, 2009.
View ArticleInyang, M.I., Gao, B., Yao, Y., Xue, Y., Zimmerman, A., Mosa, A., Pullammanappallil, P., Ok, Y.S., Cao, X "A review of biochar as a low-cost adsorbent for aqueous heavymetal removal.," Crit. Rev. Environ. Sci. Technol., pp. 46, 1950-1956, 2015.
View ArticleNakajima, M., Tsubouchi, H., Miyabe, M., Ueno, Y "Survey of aflatoxin B-1 and ochratoxin A in commercial green coffee beans by high-performance liquid chromatography linked with immunoaffinity chromatography," Food and agricultural immunology, pp. 9:77-83, 1997.
View ArticleBordoloi, N., Narzari, R., Chutia, R.S., Bhaskar, T., Kataki, R "Pyrolysis of Mesua and Pongamia glabraseed cover: characterization of bio-oil and its subfractions," Bioresour. Technol, p. 83-89, 2015.
View ArticleYang, G.B., Wang, Z., Xian, Q., Shen, F., Sun, C., Zhang, Y., Wu, J "Effects of pyrolysis temperature on the physicochemical properties of biochar derived from vermicompost and its potential use as an environmental amendment," RSC Adv., pp. 5, 40117-40125., 2015.
View ArticleZhao, B., O'Connor, D., Zhang, J., Peng, T., Shen, Z., Tsang, D.C.W., Hou, D "Effect of pyrolysis temperature, heating rate, and residence time on rapeseed stem derived biochar.," J. Clean. Prod. , pp. 174, 977-987, 2017a.
View ArticlePark, Y., Ayoko, G.A., Horváth, E., Kurdi, R., Kristof, J., Frost, R.L "Structural characterisation and environmental application of organoclays for the removal of phenolic compounds," J. Colloid Interface Sci.,, pp. 393, 319-334, 2013.
View ArticleXu, J., Wang, L., Zhu, Y "Decontamination of bisphenol A from aqueous solution by graphene adsorption," Langmuir, pp. 28, 8418-8425, 2012.
View ArticleCano-Sancho, G., Marin, S., Ramos, A.J., Sanchis, V "Biomonitoring of Fusarium spp. mycotoxins: perspectives for an individual exposure assessment tool," Food Sci., 2010.
View ArticlePfohl-Leszkowicz, A., Hadjeba-Medjdoub, K., Ballet, N., Schrickx, J., Fink-Gremmels, J "Assessment and characterisation of yeast-based products intended to mitigate ochratoxin exposure using in vitro and in vivo models.," Food Addit. Contam., pp. 32, 604-616, 2015.
View ArticleWang, Z., Han, L., Sun, K., Jin, J., Ro, K.S., Libra, J.A «Sorption of four hydrophobic organic contaminants by biochars derived from maize straw, wood dust and swine manure at different pyrolytic temperatures .» Chemosphere, 2016: 144, 285-291.
View Article