Zhixiang Xu
Email: zhixiangxu@sina.com
© 2019 Sift Desk Journals. All Rights Reserved
VOLUME: 4 ISSUE: 8
Page No: 924-933
Zhixiang Xu
Email: zhixiangxu@sina.com
Peng Zhao, Yanping Zhang, Mingdi Jiang, Zhixiang Xu*
Key Laboratory of Food Processing Technology and Quality Control in Shandong Province, College of Food Science and Engineering, Shandong Agricultural University, Tai’an 271018, People’s Republic of China
Katarzyna Witt(Katarzyna.Witt@utp.edu.pl)
Jana Ghitman(ghitmanjanusik@yahoo.com)
Ioannis Partheniadis(ioanpart@pharm.auth.gr)
Chang Guo(guochang@mail.dhu.edu.cn)
Zhixiang Xu, Peng Zhao, Yanping Zhang, Mingdi Jiang, Establishment of Prediction Model of DEHP and DEHA Migration from PVC Film into Pork (2019) Journal of Food Science & Technology 4(8) pp:924-933
In this study, the migration rule of plasticizer to pork and its influencing factor (temperature and fat content) were studied with DEHP and DEHA in polyvinyl chloride (PVC) fresh-keeping film as objects. Based on the migration experimental data, the predicted model of DEHP and DEHA was presented using established Weibull distribution probability model. Finally, the migration prediction values, and experimental values were compared under two different conditions (17.5% fat content at 40 °C and 37.5% fat content at 25 °C), and the results showed that there were no significant differences.
Keywords: PVC, plasticizer, Weibull, migration rule, prediction model
Plasticizer, as a kind of important chemical product additives, is widely used in industrial polymer materials, making them more flexible and easier to process [1-3]. Plasticizers in polyvinyl chloride (PVC) are not fully reacted with polymer molecules during processing, and some of them connected with Van der Waals forces and hydrogen bonds in the material, which is easy to diffuse and migrate [4-6].
At present, the migration experiments of plasticizer mainly focus on two aspects: One is the migration test of the real food, namely the migration of plasticizers to different types of food under contact with food packaging materials [7,8]; Another is the simulation test, which is the migration of plasticizer from packaging materials to various food simulation liquid [9-11]. The factors that affect the speed of migration include temperature, structure of polymer materials, molecular structure of migration, plasticizer content, etc [12,4,13]. Temperature is the most important influencing factor. The increase of temperature will improve the energy of migration and accelerate the speed of migration. Additionally, the increase of temperature can also increase the volume inside the material, which can change the accumulation and arrangement of polymer molecular segments, and then form different aggregation structures (divided into crystalline and non-crystalline regions), thus affecting the migration of small molecules [3]. The previous study reported the effects of different temperature on the migration of DEHP and DBP to the simulated liquid in polypropylene plastic packaging.
The food matrix or composition of food mimics have great influence on migration, such as protein content, fat content, and moisture content. The effects of different lipid mimics on the migration behavior of four plasticizers (DIBP, DBP, DEHP, and DEHA) in PVC film had been investigated [14]. The results showed that the migration of the four plasticizers increased with the increase of fat content in the simulated solution. When the fat content was below 20%, the migration of DEHP and DEHA macromolecular plasticizers was very low, while the migration level increased rapidly when the fat content was 50% and 95%.
The hazardous substances that can migrate from the packaging material into contact food are in small quantities, as well as there are many kinds of food. Therefore, it is difficult to use actual food to carry out migration experiment. It will be very convenient and timesaving to establish a mathematical model to predict the migration of chemical substances. It can not only avoid tedious operation and expensive instruments, but also can be used to evaluate the safety of materials. However, there is a lack of sufficient experimental data to support the study of the migration by a simple mathematical model. Hence, it is necessary to combine the mathematical prediction model with the specific data obtained by the chemical experimental method for the study, so as to have a more comprehensive understanding of the impact of various factors on the migration of chemical substances and evaluate the safety of packaging materials. The researches on the mathematical model of food packaging material migration mainly focus on the Fick model and the Non-Fick model, among which the Fick model is earlier and more mature [15]. However, there is little research on Non-Fick model.
Weibull model is one of Non-Fick models, which has the characteristics of strong adaptability and few parameters, can save the complicated physical and chemical migration process [16-18]. Weibull model has been widely used to assess the quality and safety of food processing [15,19,20], but in terms of food packaging materials, there are few reports on the Weibull model. In 2011, Poças group used Weibull model to describe the migration of plasticizer to Tenax in paper materials and studied the effect of different parameters on the migration behavior. At the same time, two models, Weibull model and Fick model, were compared [15]. In 2012, Poças gourp again used the Weibull model to describe the migration behavior of a variety of additives in plastic packaging. The results showed that the value of τ was related to the film thickness and diffusion coefficient. Besides, the logarithm of τ had a certain linear relationship with the activation energy and depended on the material properties during the migration of small molecules. Compared with Fick model, Weibull model had better S-shape migration curve, which made it become a simple and reliable method to evaluate the safety of materials. The factors affecting the parameters in the model were discussed in the above studies, but all of them were based on the experimental data of the migration of additives into food simulants. In this study, the migration of DEHP and DEHA from PVC film to pork under different conditions was studied. Based on the experimental data, the predicted model of DEHP and DEHA was presented using established Weibull prediction model, and the predicted value was compared with the experimental value.
2.1. Chemicals
Bis(2-Ethylhexyl) Phthalate (DEHP, 98%) and Bis(2-Ethylhexyl)Adipate (DEHA, 99.2%) were purchased from Beijing Dikma Technology Co., Ltd. (Beijing, China). Acetonitrile (Chromatography Pure) was purchased from Shandong Yuwang Industrial Co., Ltd. (China). N-hexane (Chromatography Pure) and concentrated hydrochloric acid (37.5%) were purchased from Tianjin Kaitong Chemical Reagent Co., Ltd. (China). Acetone (Chromatography Pure) was purchased from Tianjin Yongda Chemical Reagent Co., Ltd. (China).
2.2. Apparatus
A Shimadzu 2010 gas chromatograph (GC) equipped with a flame photometric detector (Shimadzu, Kyoto, Japan) was used for the determination of plasticize. The separation was conducted on a Rtx-5 elastic quartz capillary column (30 m × 0.32 m × 0.25 μm). Nitrogen was used as the carrier gas at a constant flow rate of 1.5 mL/min, and the injection volume was 1 μL. The injection port temperature was 250 °C. The detector temperature was held constant at 280 °C. The temperature-raising process was as follows: the initial temperature was 60 °C for 2 min. Then, the temperature was raised to 220 °C at the speed of 20 °C/min. After kept for 3 min, the temperature was raised to 280 °C at the speed of 5 °C/min and kept for 5 min.
2.3. The extraction of plasticizer in pork
Firstly, 2.00 g of pork was placed in a 25 mL plug tube, and then 2 mL of n-hexane and 10 mL of acetonitrile were added. After ultrasonicated for 20 min, the extracting solution was placed in the glass centrifuge tube and repeated the above steps. Then, the two extracts were combined and centrifuged at 8000 r/min for 10 min. The supernatant was blown dry by nitrogen under a water bath of 40 °C, and 2 mL of n-hexane was added. After homogeneous mixing, the mixture was purified by solid-phase extraction column.
2.4. The purification of extracting solution
In order to activate the extraction column, 5 mL of acetone and 5 mL of n-hexane were added for eluting. Afterwards, the extracting solution was added at the flow rate of 1 mL/min. Then, the eluent was collected and mixed with 5 mL of n-hexane and 5 mL of 4% acetone-n-hexane solution, and then the eluent was collected and blown dried by nitrogen under a water bath of 40 °C. The volume of the mixture was adjusted to 1 mL with n-hexane. Finally, the solution was filtered using 0.22 μm filter membrane and stored for use.
2.5. The migration of plasticizer in pork
The fat contents of two portions of fresh pork (fat pork and lean pork) were determined by acid hydrolyzation, and then adjusted to 7%, 20%, 40% as needed, respectively and mix well for use.Then, two pieces of circular PVC film (about 4.48 cm2) were prepared, one of which was placed at the bottom of the beaker and evenly covered with 2.00 g of pork with known fat content, and another slice was tightly compressed on the pork. After placed at 4, 20, 70 °C for a certain time (1 h, 12 h, and 60 h for DEHP; 1.5 h, 15 h, and 70 h for DEHA), the pork was gotten out and the grease on the film was wiped off with degreased cotton. Then, the degreased cotton and pork were placed in a 25 mL plug tube. Finally, the fat was extracted and determined (deducting the original fat value in pork).
2.6. Establishment of Weibull migration model
The establishment of the Weibull model was based on the mathematical formula, and the obtained experimental data was fitted using the mathematical analysis software. Then, the relationship between the parameters and the variables was established, and a specific model was obtained.
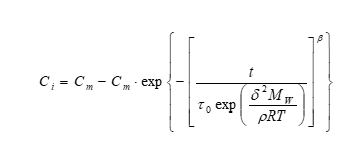
Webull exponential function formula is as follows:
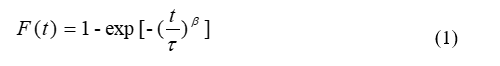
According to the diffusion condition of the plasticizer in the PVC preservative film to the pork, it can be ordered that:
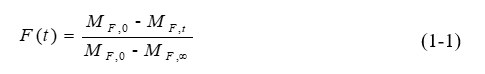
Where, MF,0 is the mass of the plasticizer in the food at the initial time, MF,t is the mass of plasticizer migrating to pork at t h, and MF,∞ is the mass of plasticizer transferring to pork during migration equilibrium. The amount of migration is expressed in terms of the amount of migration per unit of contact area, which is:
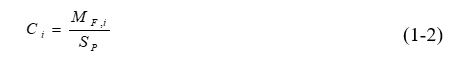
Where SP is the contact area of film and pork. Additionally, it can be considered that the plasticizer concentration in pork at the initial moment is 0, which means that:
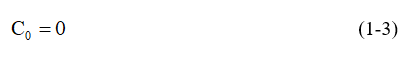
The above formulas, (1-1), (1-2), and (1-3) were brought into the formula (1) to get the formula used in this paper:
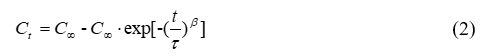
Wherein the C∞, τ, β are the nonzero positive roots.
2.7. Verification of Webull Prediction Model
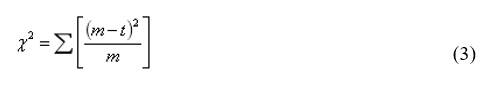
The fat contents of two portions of pork were determined by acid hydrolysis method, and then was extracted and analyzed after placed at 25 °C and 40 °C for 24 h and 4 h, respectively. Then, the experimental values were compared with the predicted values of the model by chi-square test, and χ2 and χ20.05 were compared to verify whether there were differences between the predicted values and the experimental values. The formula of chi-square test is shown below, where m is the predicted value and t is the experimental value:
3.1. Fitting of Weibull model parameters
According to the formula (2), there are two ways to fit: The first one is that three parameters fitting is carried out by direct use of the migration divergence point under different conditions, and the second one is that the maximum mobility C∞ is obtained firstly, and then used as a known parameter to fit the two parameters. The fitting of two or three parameters was performed by using the nonlinear fitting function of Origin software for iterative fitting until the parameters were stable. When solving the maximum migration C∞, the polynomial must be constructed first [21]:
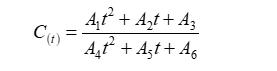
Wherein, A1, A2, A3, A4, A5, and A6 are all constant parameters of this polynomial. When t tends to infinity, C∞=A1/A4. The fitting values of the maximum mobility are shown in Table 1.
Table 1. The maximal migration value fitted by polynomial.
|
Fat content |
Plasticizer |
Temperature |
||
|
70 °C |
20 °C |
4 °C |
||
|
40% |
DEHP |
11.638 |
13.089 |
13.147 |
|
DEHA |
8.971 |
9.147 |
8.571 |
|
|
20% |
DEHP |
13.648 |
12.880 |
13.603 |
|
DEHA |
8.486 |
8.995 |
8.444 |
|
|
7% |
DEHP |
14.741 |
11.696 |
12.513 |
|
DEHA |
10.168 |
7.680 |
7.925 |
|
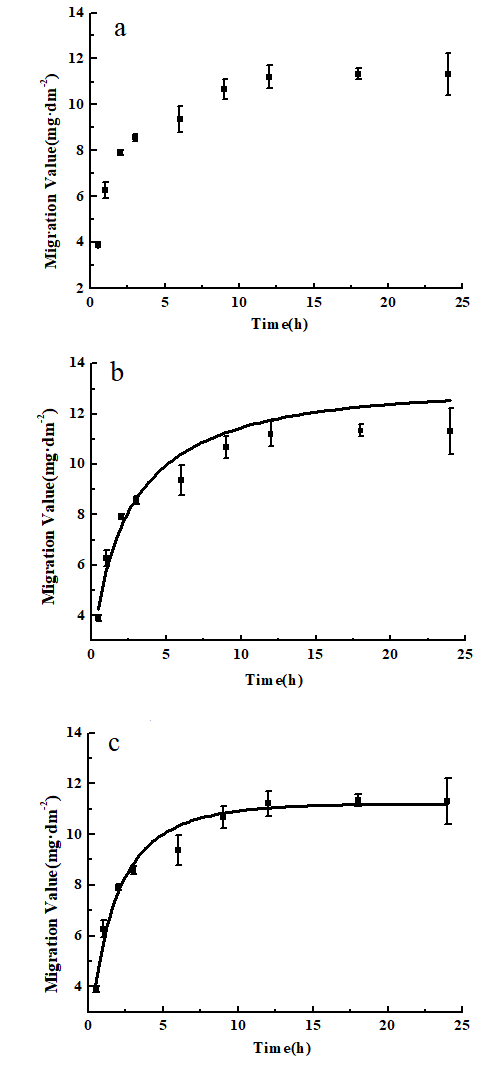
Fig. 1. Different parameter fitting diagrams of DEHP with 20% fat content fitting at 20 °C: (a) scatter point, (b) 2 parameter fitting, (c) 3 parameter fitting.
As shown in Figure 1, 1(a) is the scattered point diagram of DEHP with 20% fat content at 20 °C. By adding the maximum migration amount, 12.880 into formula (2) and fitting two-parameters with τ and β, Figure 1(b) was obtained, and the value of τ, β and R2 was obtained, which was 2.509, 0.570 and 0.962, respectively. Figure 1(c) is a fitting diagram of 3 parameters, τ, β and C∞. The value of C∞, τ, β, and R2 was 11.219, 1.601, 0.704, and 0.988, respectively. The scattered points under all conditions were fitted with two parameters and three parameters, and the obtained parameters were compared. The results are shown in Table 2.
Table 2. Parameter values of weibull model in different fitting methods.
|
Temperature |
Fat content |
Plasticizer |
Fitted by two parameters |
Fitted by three parameters |
|||||
|
τ |
β |
R2 |
C∞ |
τ |
β |
R2 |
|||
|
70 °C |
40% |
DEHP |
0.240 |
0.967 |
0.930 |
13.711 |
0.355 |
0.820 |
0.989 |
|
DEHA |
0.152 |
0.929 |
0.893 |
10.033 |
0.203 |
0.770 |
0.999 |
||
|
20% |
DEHP |
0.407 |
0.564 |
0.967 |
12.632 |
0.292 |
0.743 |
0.987 |
|
|
DEHA |
0.191 |
0.573 |
0.996 |
8.351 |
0.180 |
0.602 |
0.996 |
||
|
7% |
DEHP |
0.668 |
0.364 |
0.963 |
11.658 |
0.262 |
0.671 |
0.997 |
|
|
DEHA |
0.987 |
0.445 |
0.980 |
8.267 |
0.448 |
0.569 |
0.988 |
||
|
20 °C |
40% |
DEHP |
1.225 |
0.670 |
0.941 |
12.301 |
0.988 |
0.833 |
0.956 |
|
DEHA |
1.304 |
0.503 |
0.953 |
8.738 |
1.400 |
0.786 |
0.969 |
||
|
20% |
DEHP |
2.509 |
0.570 |
0.962 |
11.219 |
1.601 |
0.704 |
0.988 |
|
|
DEHA |
2.672 |
0.496 |
0.980 |
8.285 |
1.973 |
0.618 |
0.988 |
||
|
7% |
DEHP |
1.919 |
0.564 |
0.990 |
11.028 |
1.476 |
0.662 |
0.997 |
|
|
DEHA |
1.861 |
0.525 |
0.982 |
7.401 |
1.631 |
0.554 |
0.981 |
||
|
4 °C |
40% |
DEHP |
11.681 |
0.580 |
0.978 |
12.331 |
6.393 |
0.857 |
0.991 |
|
DEHA |
5.096 |
0.841 |
0.933 |
9.061 |
6.276 |
0.735 |
0.982 |
||
|
20% |
DEHP |
13.906 |
0.431 |
0.944 |
11.915 |
7.624 |
0.717 |
0.953 |
|
|
DEHA |
11.512 |
0.589 |
0.993 |
8.043 |
9.601 |
0.632 |
0.995 |
||
|
7% |
DEHP |
14.833 |
0.554 |
0.980 |
11.524 |
11.955 |
0.678 |
0.995 |
|
|
DEHA |
11.143 |
0.505 |
0.990 |
7.413 |
8.683 |
0.565 |
0.995 |
||
The correlation coefficients of the two fitting methods were both greater than 0.9, which indicated that Weibull model could well display the variation law of plasticizer migration to pork. By comparing R2 values, it could be found that the fitting of three parameters was higher than that of two parameters, which was because there is multicollinearity among several parameters [15]. Therefore, three parameters fitting was more linear correlation with the actual situation, which could reduce the steps of C∞ solution and the analysis time.
3.2. Confirmation of the relationship between parameters
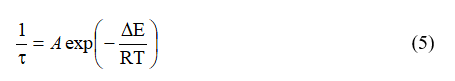
In order to establish the Weibull prediction model, it is the key to determine the influencing factors of C∞, τ and β parameters and to obtain the parametric expression. According to previous studies, τ as a parameter affected the migration rate and had no correlation with β [17]. The migration rate decreased with the increase of τ, and it satisfied Ahrrenius isothermal equation of K=A·exp (-E/RT) (Mulet et al., 2006). Chi research group established the relationship between τ and physicochemical properties of small molecular transport compounds based on the concepts of solubility parameters and cohesive energy density [22]. In this study, we constructed the formula of τ according to the method of Chi research group. Firstly, the Ahrrenius relation formula containing τ was established:
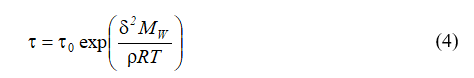
Since ΔE was unknown, the definitions of cohesive energy density, CED (CED=E/V) and solubility parameter (δ2=CED) needed to be added. Additionally, V=MW/ρ. Therefore, the relation between τ and temperature was obtained, which is
Wherein τ0 is constant, MW is the relative molecular weight of plasticizer, ρ is the plasticizer density (g/cm3), T is thermodynamic temperature (K), and δ is plasticizer solubility parameter, which can be calculated by δ=∑F/V=ρ·∑F/MW, where F was the small constant of each substituent of plasticizer. Therefore, δDEHP=18.277 (J/cm3)1/2, and δDEHA=17.439 (J/cm3)1/2, and the τ0 values under different migration conditions can be obtained by formula (5).
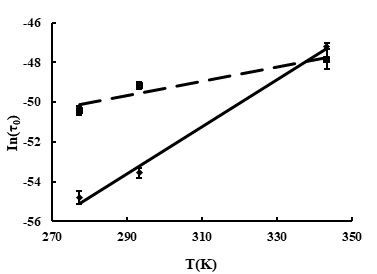
Fig. 2. The relationship between temperature and τ0.
Table 3. The value of τ0 under different conditions.
|
Temperature |
Plasticizer |
τ |
τ0 |
||||
|
70 °C |
DEHP |
0.355 |
0.292 |
0.262 |
3.777E-21 |
3.109E-21 |
2.785E-21 |
|
DEHA |
0.203 |
0.180 |
0.448 |
1.334E-21 |
1.184E-21 |
2.947E-21 |
|
|
20 °C |
DEHP |
0.987 |
1.601 |
1.476 |
4.121E-24 |
6.677E-24 |
6.156E-24 |
|
DEHA |
1.400 |
1.973 |
1.631 |
3.863E-22 |
5.446E-22 |
4.500E-22 |
|
|
4 °C |
DEHP |
6.393 |
7.624 |
11.955 |
1.192E-24 |
1.421E-24 |
2.229E-24 |
|
DEHA |
6.276 |
9.621 |
8.683 |
9.861E-23 |
1.512E-22 |
1.364E-22 |
|
The τ0 values under different conditions are shown in Table 3. It was found that the higher the temperature was, the larger the τ0 was, and the relationship between In(τ0) and temperature (K) was shown in Figure 2. The results showed that there was a good linear relationship between In(τ0) and temperature, and the correlation coefficient (R2) was 0.993 and 0.921, respectively. Besides, the relational expression and correlation coefficient of Weibull model for DEHP and DEHA was shown in Table 4, which showed that the τ0 of DEHP was more greatly affected by temperature. It took shorter time for DEHP to achieve equilibrium, which were consistent with the previous conclusion.
Table 4. The expression and correlation coefficient of Weibull model.
|
Parameters |
DEHP |
DEHA |
||
|
Relational expression |
R2 |
Relational expression |
R2 |
|
|
τ0 |
τ0 = exp (0.1183T - 87.888) |
0.993 |
τ0 = exp (0.0359T - 60.076) |
0.921 |
|
β |
Β = 0.4811 x + 0.6387 |
0.981 |
Β = 0.6107 x + 0.5123 |
0.982 |
|
Cm |
Cm = 5.1097 x + 10.783 |
0.986 |
Cm = 4.8374 x + 7.3189 |
0.996 |
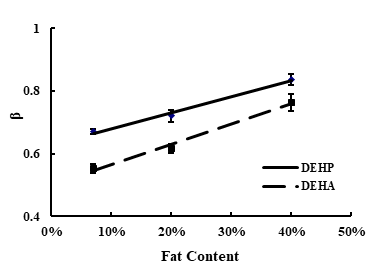
Fig. 3. The relationships between fat conten and β.
The parameter β had nothing to do with temperature during the mass transfer process, while related with the contact medium, the migration materials and the material types [17,19,22]. In this experiment, using pork with different fat content as contact medium, the relationship between β and fat content was established. As shown in Figure 3, in the range of 7-40% fat content, the β value changed linearly with the increase of fat content, and the relationship was shown in Table 4, which indicated that the correlation coefficient for DEHP and DEHA was 0.981 and 0.982, respectively.
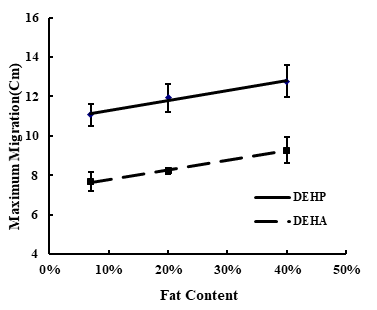
Fig. 4. The relationships between fat conten and Cm.
Table 5. The maximum migration value under different fat contents.
|
Fat content |
DEHP mg/kg |
DEHA g/kg |
||||
|
70 °C |
20 °C |
4 °C |
70 °C |
20 °C |
4 °C |
|
|
40% |
13.711 |
12.301 |
12.331 |
10.033 |
8.738 |
9.061 |
|
20% |
12.632 |
11.219 |
11.915 |
8.351 |
8.286 |
8.043 |
|
7% |
11.658 |
11.028 |
10.524 |
8.267 |
7.401 |
7.413 |
Table 5 showed the maximum migration amount (Cm) of plasticizers when porks with different fat content were used as contact medium. Cm varied with fat content. It was mainly because that fat permeated into the molecular chain of PVC, and swelling occured, which leaded to the increase of distance between PVC molecules and the increase of the free volume [4]. The relationship between Cm and fat content (x) was shown in Figure 4. There was a linear relationship between Cm and fat content, and the correlation coefficients were 0.986 and 0.996, which were shown in Table 4. Therefore, the maximum migration of plasticizer can be predicted more accurately by determining the fat content of pork.
Based on the above relationships between parameters of Weibull model with their influence factors, the Weibull model could be expressed as following:
Wherein MW was the relative molecular mass of plasticizer, ρ was the density of plasticizer (mg/cm3), T was Kelvin temperature (K), the value of δDEHP was 18.277 (J/cm3)1/2, and the value of δDEHA was 17.439 (J/cm3)1/2.
3.3. Validation of Weibull model accuracy
In order to evaluate the accuracy of the Weibull model, it is necessary to compare the predicted values with the measured values. Firstly, two portions of pork were taken at random and determined the fat content. Then, the migration experiments were carried out at 25 °C and 40 °C, respectively, and the plasticizer migration data were obtained as shown in Figure 5 and Figure 6.
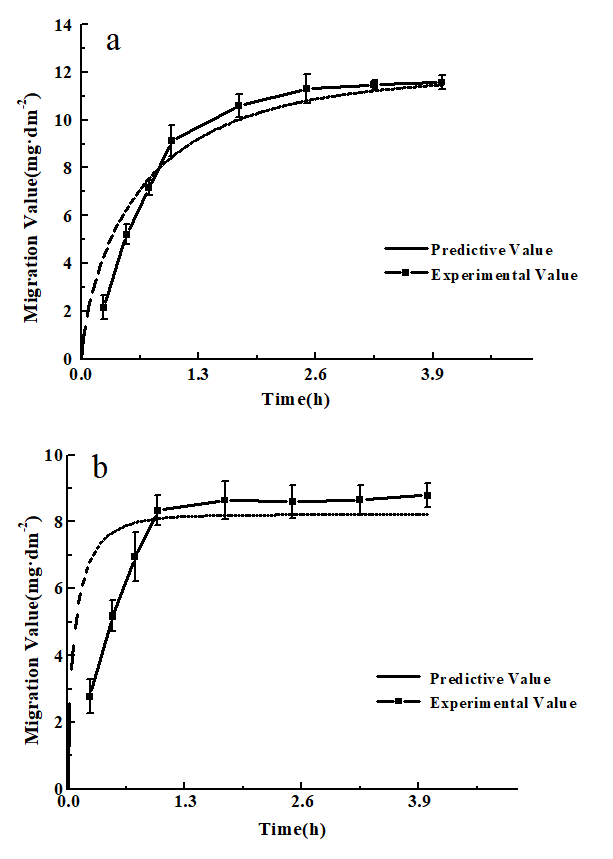
Fig. 5. Comparison of experimental and predictive values of DEHP (a) and DEHA (b) in pork with 17.5% fat content at 40 °C.
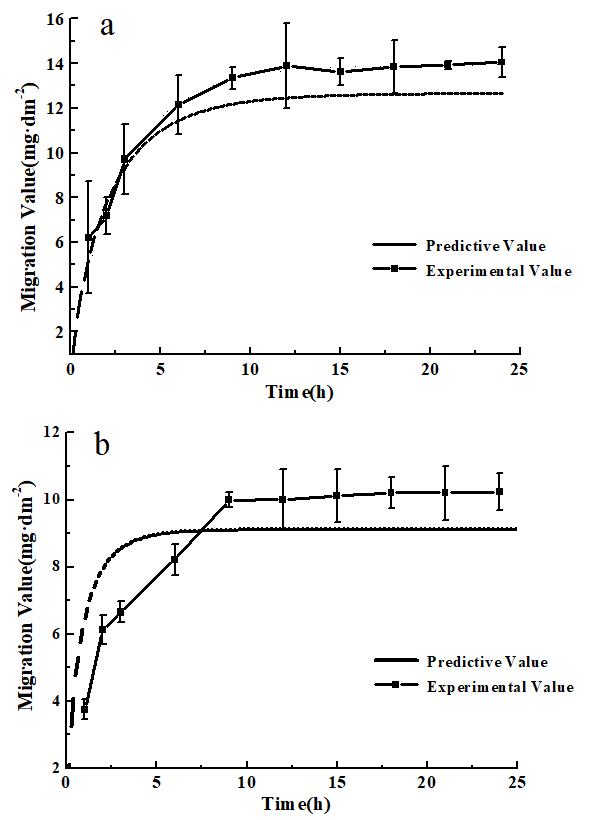
Fig. 6. Comparison of experimental and predictive values of DEHP (a) and DEHA (b) in pork with 37.5% fat content at 25 °C.
The chi-square test of the prediction value and the measured value of the model under different conditions were shown in Table 6. Both DEHP and DEHA satisfied χ2 < χ20.05, and the probability of chi-square test was greater than 0.05 (P > 0.05), indicating that there was no difference between the theoretical value and the measured value. Hence, the Weibull model is in good agreement with the experimental data and can predict the plasticizer migration.
Table 6. The chi-square value between predictive value and experiment value.
|
Item |
Chi-square with 17.5% fat content at 40 °C |
Chi-square with 37.5% fat content at 25 °C |
||
|
DEHP |
DEHA |
DEHP |
DEHA |
|
|
χ2 |
1.344 |
3.290 |
2.267 |
3.178 |
PVC material is a kind of material which is allowed to be used in food packaging according to national standards, but it has strict requirements for its use and the content of additives. The migration of the plasticizer to the pork belongs to the resistance type of the food phase. Additionally, the content of the plasticizer of the other PVC film is large, which can lead to the change of the thickness of the film when a slight swelling occurs in the contact with the pork. At present, the research on the mathematical model of migrating substance is mainly focused on the Fick model, but its application is limited by many conditions of the model. Therefore, we need to establish a new mode that is not subject to these conditions. Weibull model is an exponential model, which is not limited by the above application conditions.
In this study, the migration rule of plasticizer to pork and its influencing factor were studied with DEHP and DEHA in PVC preservative film as objects. Based on the migration experimental data, the predicted model of DEHP and DEHA was presented using established Weibull distribution probability model. The model can be applied to predict plasticizers migration from PVC into pork, and then provide some ideas for the control of plasticizer migration in PVC preservative film.
The authors are grateful for financial supports from the National Key R & D Program (NO. 2016YFD04011201).
Alin J, & Hakkarainen, M. Migration from polycarbonate packaging to food simulants during microwave heating. Polym. Degrad. Stabil. 97, 1387-1395 (2012).
View ArticleBrostow W, Lu X, & Osmanson AT. Nontoxic bio-plasticizers for PVC as replacements for conventional toxic plasticizers. Polym. Test. 69, 63-70 (2018).
View ArticleLi C, Zheng S, Chen J, Xie HB, Zhang YN, Zhao Y, & Du Z. Kinetics and mechanism of ·OH-initiated atmospheric oxidation of organophosphorus plasticizers: A computational study on tri-p-cresyl phosphate. Chemosphere 201, 557-563 (2018). PMid:29533805
View Article PubMed/NCBIYu BY, Lee AR, & Kwak SY. Gelation/fusion behavior of PVC plastisol with a cyclodextrin derivative and an anti-migration plasticizer in flexible PVC. Eur. Polym. J. 48, 885-895 (2012).
View ArticleColtro L, Pitta JB, Costa PAD, Perez MÂF, Araújo VAD, & Rodrigues R. Migration of conventional and new plasticizers from PVC films into food simulants: A comparative study. Food Control 44, 118-129 (2014).
View ArticleEckert E, Müller J, & Göen T. Simultaneous determination of polyvinylchloride plasticizers di(2-ethylhexyl) phthalate and tri(2-ethylhexyl) trimellitate and its degradation products in blood by liquid chromatography-tandem mass spectrometry. J. Chromatogra. A 1410, 173-180 (2015). PMid:26243703
View Article PubMed/NCBIKontominas MG, Goulas AE, Badeka AV, & Nerantzaki A. Migration and sensory properties of plastics-based nets used as food-contacting materials under ambient and high temperature heating conditions. Food Addit. Contam. 23, 634-641 (2006). PMid:16766462
View Article PubMed/NCBIBernard L, Décaudin B, Lecoeur M, Richard D, Bourdeaux D, Cueff R, Sautou V, & Feutry F. Analytical methods for the determination of DEHP plasticizer alternatives present in medical devices: a review. Talanta 129, 39-54 (2014). PMid:25127563
View Article PubMed/NCBIZhang Y, & Han JH. Mechanical and thermal characteristics of pea starch films plasticized with monosaccharides and polyols. J. Food Sci. 71, 109-118 (2006).
View ArticleGamage PK, & Farid AS. Migration of novel epoxidized neem oil as plasticizer from PVC: experimental design approach. J. Appl. Polym. Sci. 121, 823-838 (2011).
View ArticleBier JM, Verbeek CJR, & Lay MC. Plasticizer migration in bloodmeal-based thermoplastics. J. Appl. Polym. Sci. 131, 1001-1007 (2013).
View ArticleKampouris EM. The migration of plasticizers from poly(vinyl chloride) into edible oils. Polym. Eng. Sci. 16, 59-64 (2010).
View ArticleGao S, Wang ZW, & Chang-Ying HU. Migration of plasticizers from paper packaging inks to food(simulant) under microwave heating. Food Sci. 35, 6-9 (2014).
Du ZN, Miao HJ, Li JJ, & Wu YN. Research on the migration regularity and the modeling building of plasticizers in food contact material PVC. J. Food Safe. 195, 564-575 (2015).
Poças MF, Oliveira JC, Pereira JR, Brandsch R, & Hogg T. Modelling migration from paper into a food simulant. Food Control 22, 303-312 (2011).
View ArticleHalder A, Datta AK, & Geedipalli SSR. Uncertainty in thermal process calculations due to variability in first order and Weibull kinetic parameters. J. Food Sci. 72, 155-167 (2007). PMid:17995767
View Article PubMed/NCBICunha LM, Oliveira FAR, Aboim AP, Frías JM, & Pinheirotorres A. Stochastic approach to the modelling of water losses during osmotic dehydration and improved parameter estimation. Int. J. Food Sci. Tech. 36, 253-262 (2010).
View ArticleAbaidoo-Ayin HK, Boakye PG, Jones KC, Wyatt VT, Besong SA, & Lumor SE. Compositional analyses and shelf-life modeling of njangsa (ricinodendron heudelotii) seed oil using the Weibull hazard analysis. J. Food Sci. 82, 1799-1806 (2017). PMid:28631807
View Article PubMed/NCBIBlasco M, Pérez JVG, Bon J, Malonda CJE, & Mulet A. Effect of blanching and air flow rate on turmeric drying. Food Sci. Tech. Int. 12, 315-323 (2006).
View ArticleKhan MAM, Ahrne L, Oliveira JC, & Oliveira FAR. Prediction of water and soluble solids concentration during osmotic dehydration of mango. Food Bioprod. Process. 86, 7-13 (2008).
View ArticlePoças MF, Oliveira JC, Oliveira FA, & Hogg T. A critical survey of predictive mathematical models for migration from packaging. Crit. Rev. Food Sci. 48, 913-928 (2008). PMid:18949594
View Article PubMed/NCBIChi H, Liu Y, Gao X, Liu W, & Luo Y. Antioxidant BHT modelling migration from food packaging of high density polyethylene plastics into the food simulant. Adv. J. Food Sci. Tech. 9, 534-538 (2015).
View Article