Ting Ding, Yong Li
Tel.: +86-10-8280-1177;
Email address: dingting0532@163.com; liyongbmu@163.com.
© 2019 Sift Desk Journals. All Rights Reserved
VOLUME: 5 ISSUE: 7
Page No: 275-292
Ting Ding 1, Yong Li 1*
1 Department of Nutrition and Food Hygiene, School of Public Health, Peking University, Beijing 100191, China;
Ting Ding, Yong Li, (2020) Quorum sensing inhibitory effects of vanillin on the biofilm formation of Pseudomonas fluorescens P07 by transcriptome analysis. Journal of Food Science & Technology 5(7):275-292
Pseudomonas fluorescens is an important psychrotrophic food-spoilage bacterium. Quorum sensing (QS) enables bacteria to control various physiological processes. Hence, targeting bacterial QS would be a novel method to improve food quality. In this study, P. fluorescens P07 was treated with vanillin, which showed strong QS inhibitory activity, and its resultant effects on swarming motility, biofilm formation, and extracellular polymeric substance (EPS) secretion were measured. The mechanisms underlying the inhibitory effects were then explored by transcriptomic analysis. The results showed that vanillin had inhibitory effects on swarming motility, biofilm formation, N-acyl-L-homoserine Lactone (AHLs) and EPS secretion of P. fluorescens P07. The result of transcriptionomic tests indicated that the decrease in bacterial biofilm formation was probably due to the influence of vanillin on mobility, adhesion, chemotaxis, EPS secretion, and QS system of the bacteria.
Keywords: Pseudomonas fluorescens, quorum sensing, biofilm formation, transcriptome analysis, swarming motility
In the natural environment, microorganisms adhere to the surface of active or inactive objects to form a structural community, and they secrete viscous extracellular polymers to form a surrounding matrix, or biofilm. Biofilms can protect bacteria from antibiotics, chlorine, detergents, host immune defense mechanism, and other factors, making the resident bacteria more resistant to adverse environmental factors than planktonic bacteria (Kazemian et al., 2015) (Stankowska et al., 2012; Wahman et al., 2015). Food spoilage bacteria can also produce biofilms, which allow adherence to the surface of food or food equipment, leading to food spoilage. More seriously, this threatens food safety and human health. Once biofilms are formed on food or food equipment, it is difficult to remove them completely (Imamura et al., 2004; Cady et al., 2012). Therefore, the prevention of bacterial biofilms production and food contamination remains a tough challenge. Pseudomonas fluorescens is a food-spoilage organism. Besides, it is also a psychrophile, which affects many types of refrigerated products, such as aquatic products, dairy and meat (Arnaut-Rollier et al., 1999; Rajmohan et al., 2002; Speranza et al., 2012; de Oliveira et al., 2015; Wang et al., 2019). P. fluorescens secrets hydrolytic enzymes, such as lipases and proteases to decompose the protein in food into amino acids and short peptides, and further decomposes them into hydrogen sulfide, putrescine aldehyde, ketone, ester, organic acid and various toxic substances (Zhang et al., 2019). Besides, it can form biofilms, which pose threat to the quality and safety of aquatic products (Gennari M, 1992; M. Gennari1, 1999; Boziaris et al., 2013; Bekaert et al., 2015). It is therefore important to control the formation of biofilms to preserve aquatic products. It has been found that the signal molecules secreted by the bacteria could change both the distribution of specific bacteria in the biofilm and the expression of proteins in adjacent cells, and confer new genetic characteristics to adjacent cells, or induce bacterial entry to the biofilm (Bodini et al., 2009; Anbazhagan et al., 2012; Anand et al., 2013; Abraham, 2016).
Quorum sensing is a mechanism of communication between bacteria. It is also a process in which bacteria adjust their physiological and biochemical characteristics according to their population density. Bacteria use the signaling molecules, namely, auto inductors (AIs) to communicate. AIs will accumulate with the increase of bacterial density. Once the threshold is reached, the signaling molecules will be sensed by a variety of receptors, and then activate or inhibit the expression of specific target genes, leading to the production of various of bacterial behaviors, such as virulence factor secretion, biofilm formation, swimming and swarming motility, competence and symbiosis. AHLs are used by most gram-negative bacteria, while autoinducing peptides (AIP) are used by Gram positive bacteria. AI-2 is used by both Gram-negative and Gram-positive bacteria. The quorum sensing network and biofilm play an important part in the survival of P. fluorescens in the environment. It mainly uses LuxI/R type quorum sensing system. In its QS pathway, the signal molecules AHLs are produced by LuxI-type protein and combine with LuxR-type protein, thus triggering the expression of related genes, making bacteria produce specific physiological activities. Different signal molecules were produced by different P. fluorescens strains (Laue et al., 2000; X. Cui, 2005; Martins et al., 2014). EI-Sayed et al. found that P. fluorescens NCIMB 10586 used the mpuI-mpuR system in its QS. And this LuxI/R-type QS system regulated the biosynthesis of mupirocin (El-Sayed et al., 2003). Kalia et al. found that the only known compound in the QS system of P. fluorescens F113 was AHL synthetase and its produced AHLs. AHL synthetase (HdtS protein) could produce three kinds of AHLs, namely, N-hexanoyl-HSL, N-(3-hydroxy-7-cis-tetradecenoyl)-HSL and N-decanoyl-HSL (Laue et al., 2000). Kwak et al. found that P. fluorescens 2P24 also had LuxI/R-type QS system, i.e. PcoIR system, which could synthesize six kinds of AHLs (Kwak and Weller, 2013).
However, several P. fluorescens strains have emerged with drug resistance to antibiotics, such as ampicillin and streptomycin (Alain Sarniguet, 1995). Searching for novel quorum sensing inhibitors (QSIs) to interfere with the physiological activities of bacteria may provide a potential way to eliminate bacterial resistance and extend the shelf life of food. Vanillin is a natural plant product, which can be easily extracted. As an edible fragrance, vanillin is also widely used in the food additive industry. According to the standards for uses of food additive of China (GB 2760-2014), vanillin can be used in formulas for older infants and young children, with the maximum dosage of 5 mg/100 mL. Vanillin can be also used in cereal auxiliary food for infants and young children, the maximum use is 7 mg/100 g. The production enterprise shall convert it into the use amount of formula food according to the proportion of preparation. More importantly, we found that vanillin exhibits strong QS inhibitory activity. In our previous study, we found that the strain of P. fluorescens secreted short chain and long chain signaling molecules (C4-HSL, C6-HSL, C8-HSL, C10-HSL, C12-HSL and C14-HSL). And several phenotypes in P. fluorescens were regulated by its quorum sensing (QS) system (Ding et al., 2018). Similarly, Li et al. also found that some phenotypes in P. fluorescens were regulated by QS, such as biofilm formation, extracellular protease activity and N-acyl-L-homoserine Lactone (AHLs) production (Li et al., 2019). Therefore, the formation of bacterial biofilm is closely related to the QS systems. The inhibition of biofilm formation by regulating the gene expression of biofilm factors via targeting of the bacterial QS system has become a field of interest currently. We therefore investigated the inhibitory effect of vanillin on the biofilm formation of P. fluorescens P07, and its inhibitory mechanism of action was examined using transcriptomic analysis.
N-butanoyl-L-homoserine lactone (C4-HSL), N-hexanoyl-L-homoserine lactone (C6-HSL), N-octanoyl-L-homoserine lactone (C8-HSL), N-decanoyl-L- homoserine lactone (C10-HSL), N-dodecanoyl-L-homoserine lactone (C12-HSL), N-tetradecanoyl-L-homoserine lactone (C14-HSL), and X-Gal (5-bromo-4-chloro-3-indoyl-β-D-galactopyranoside) were purchased from Sigma-Aldrich (St. Louis, MO, USA). AHLs and X-Gal were dissolved in methanol at 20 µg/mL and 20 mg/mL, respectively. Luria-Bertani (LB) medium was purchased from Beijing Aoboxing Biotech Co. (Beijing, China). Chromobacterium violaceum CV026 and Agrobacterium tumefaciens A136 were used as indicator strains to test for the presence of AHLs. C. violaceum CV026 is a mini-Tn5 mutant, and secretes violacein when it encounters exogenous short-chain AHLs (C4~C8-HSLs), but is unable to produce AHLs endogenously (Shaw, 1997). A. tumefaciens A136 produces β-galactosidase, which breaks down X-Gal when it encounters exogenous long chain AHLs (C4~C14-HSLs and 3-oxo-C4~3-oxo-C12-HSLs), leading to a distinctive blue color in the culture (Robert J. C McLean, 2004). P. fluorescens P07 was the specific spoilage organism (SSO) of turbot and it was isolated from deteriorated turbot, which is an important marine aquaculture fish in China, during cold storage. P. fluorescens P07 was stored at -80ºC in our laboratory. All the strains (1%) were cultured in Luria-Bertani (LB) broth medium to OD600 = 1.0 (160 rpm, 28 °C). C. violaceum CV026 and A. tumefaciens A136 were supplemented with 10 μL of 20 μg/mL kanamycin, 10 μL of 20 μg/mL tetracycline, and 50 μL of 20 μg/mL spectinomycin, respectively. All chemicals were purchased from commercial sources.
2.1 MIC (minimum inhibitory concentration) test of vanillin
The MIC of vanillin was tested to ensure that its anti-QS activity interfered with the bacterial QS system, without compromising cell growth. Vanillin was dissolved in 60% dimethyl sulfoxide (DMSO), and 60% DMSO was used as the blank control. MICs were determined by broth macrodilution method according to a previously described method (Ting Ding, 2017) for C. violaceum CV026, A. tumefaciens A136, and P. fluorescens P07. Briefly, an overnight culture of C. violaceum CV026 (1.0 OD at 600 nm), A. tumefaciens A136 (1.0 OD at 600 nm) and P. fluorescens P07 (1.0 OD at 600 nm) were diluted 1:100 in 10 mL LB medium, respectively. Then 100 μL of the bacterial fluid was added to a 96-well plate, and supplemented with 10 μL of twofold diluted vanillin, respectively. The plate was incubated at 28 °C for 24 h. The MIC was defined as the lowest concentration that completely inhibited visible growth of bacteria. The experiment was repeated thrice to reduce any error. The compound was used at sub-MIC concentrations (0.25, 0.50 and 1.00 mg/mL) in further assays.
2.2 Violacein inhibition and β-galactosidase assay
The anti-QS activities of vanillin under sub-MIC (1.00 mg/mL) were tested on C. violaceum CV026 and A. tumefaciens A136, as previously described (Issac Abraham Sybiya Vasantha Packiavathy, 2012). The two strains were cultured overnight (to 1.0 OD at 600 nm) and 10 mL of the culture was added to 100 mL of LB agar. LB agar was supplemented with 10 μL C6-HSL for C. violaceum CV026 and 10 μL C10-HSL and 100 μL X-Gal for A. tumefaciens A136. An aliquot of 100 μL of each prepared solution was added to a 6 mm hole punched in the agar; 60% DMSO was used as the blank control. The plates were incubated at 28 °C for 24 h to observe the color changes in the media.
2.3 Effect of vanillin on the swarming motility, biofilm formation, EPS and AHLs of P. fluorescens P07
One milliliter of the overnight culture of P. fluorescens P07 (1.0 OD at 600 nm) was added to two Erlenmeyer flasks containing 100 mL of LB medium (as control) or 100 mL of LB medium supplemented with vanillin under sub-MIC (1.00 mg/mL). The Erlenmeyer flasks were then placed in an incubator for 24 h (160 rpm, 28 ºC).The impact of vanillin on swarming motility, biofilm formation, and EPS secretion of P. fluorescens P07 were measured according to previously described methods (Ding et al., 2017).To determine the effect of vanillin on the AHLs of P. fluorescens P07, the culture was centrifuged at 12,000 g for 4 min after incubation and the cell-free supernatant was obtained. Then, the AHLs were extracted by 200 mL of ethyl acetate (contained 0.1% acetic acid (v/v)), and extraction twice. Then the extraction was let stand for 1 h. After that, the supernatant was rotary evaporated at 35 ºC to remove the solvent, and the AHLs were re-dissolved by 1 mL of methanol and filtered through 0.22 μm film. The AHLs were stored at -20 ºC and tested by Gas-chromatography-mass-spectrometry (GC-MS) (Agilent 7890N/5975, USA) following the method of the above literature. All sample injections were done in the split mode (50:1) into a HP-5 MS capillary column (30 m × 0.25 mm× 0.25 μm). Helium was used as the carrier gas at a flow rate of 1 mL/min. The GC injector temperature was 200 ℃ and the oven temperature was programmed as followed: 150 ℃ ramped at 10 ℃/min to 220 ℃, and ramped at 5 ℃/min to 250 ℃, then ramped at 0.5 ℃/min to 252.5 ℃. Mass spectrometry conditions were as followed: electron ionization source was set to 70 eV; MS Quad 150 ℃, emission current 500 μA, MS Source 230 ℃. Data were acquired by full-scan mode (m/z 35-800) and selected ion monitoring (SIM) mode (m/z 143).There were three replicates in every sample. Each measurement was performed in triplicate.
2.4 Effect of vanillin on violacein, 5-bromo-4-chloro-indigo and bacterial growth
To quantify the effect of vanillin on production of violacein, an overnight culture of C. violaceum CV026 (1.0 OD at 600 nm) were diluted 1:100 in 10 mL LB medium. Then, 10 μL of C6-HSL (20 μg/mL) was added to the medium containing vanillin under sub-MIC and incubated at 28 ºC for 24 h. To quantify the effect of vanillin on production of 5-bromo-4-chloro-indigo, an overnight culture of A. tumefaciens A136 (1.0 OD at 600 nm) were diluted 1:100 in 10 mL LB medium. Then, 10 μL of C10-HSL (20 μg/mL) and X-Gal were added to the medium containing vanillin under sub-MIC (0.25, 0.50 and 1.00 mg/mL) and incubated at 28 ºC for 24 h. The diluted culture without vanillin was served as blank control. Then, 0.5 mL of the culture was added into a 2 mL microtube. Violacein and 5-bromo-4-chloro-indigo were extracted by following the method of Zhang et al.(Juanmei Zhang, 2014). Lastly, the absorbance of the violacein and 5-bromo-4-chloro-indigo at 585 nm and 610 nm were measured, respectively. In order to determine the effect of vanillin on bacterial growth of P. fluorescens P07, an aliquot of 1 mL of P. fluorescens P07 overnight culture (1.0 OD at 600 nm) was added to Erlenmeyer flasks containing 100 mL LB medium (as control) or 100 mL LB medium supplemented with vanillin under sub-MIC. Then, the Erlenmeyer flasks were placed in an incubator at 28 ºC and shaken at 160 rpm for 24 h. The bacterial growth curve was obtained by measuring the biomass of the P. fluorescens P07 through an enzymatic analyzer (Perkin Elmer V3, USA) at 600 nm every four hours.
2.5 Transcriptome research
One milliliter of the overnight culture of P. fluorescens P07 (1.0 OD at 600 nm) was added to two Erlenmeyer flasks containing 100 mL of LB medium (as control) or 100 mL of LB medium supplemented with vanillin, to attain the concentrations of 1.0 mg/mL. The Erlenmeyer flasks were then placed in an incubator for 24 h (160 rpm, 28 ºC). Cultured bacteria were centrifuged (6000 r/min, 10 min) and washed with sterile PBS three times. An RNA extraction kit (RNB200 GenElute Total RNA Purification Maxi Kit, Sigma-Aldrich Company Ltd., United Kingdom) was used to extract bacterial RNA according to instructions. The samples were transferred to Hua da Gene (Hua da Gene Technology Service Co., Ltd., Shenzhen) for transcriptome detection.
2.5.1 Detection of total RNA
RNA concentration, RIN value, 28S/18S and the fragment length distribution were detected by Agilent 2100 Bioanalyzer (Agilent RNA 6000 Nano Kit). NanoDropTM was used to identify the purity of the RNA samples.
2.5.2 Library construction
mRNA was isolated from total RNA using the oligo (dT) method (Kuribayashi K, 1988). The extracted mRNA was then fragmented, and first- and second-strand cDNA were synthesized. cDNA fragments were purified and resolved with EB buffer for end reparation and single nucleotide A (adenine) addition. Following this, the cDNA fragments were connected with adapters. cDNA fragments of a suitable size were selected for PCR amplification. Agilent 2100 Bioanaylzer and ABI StepOnePlus Real-Time PCR System were used for quantification and qualification of the libraries.
2.5.3 Information analysis
First, the low quality reads (over 20% of the bases qualities were lower than 10), reads with adaptors, and reads with unknown bases (N bases more than 5%) were filtered to obtain clean reads. Next, Trinity software was used to perform de novo assembly with clean reads (PCR duplication was eliminated to improve efficiency), and Tgicl software was used to cluster the transcripts to unigenes. Subsequently, with unigene functional annotation, SSRPCRPCR, short for polymerase chain reaction (which is used to amplify a single copy or a few copies of a piece of DNA across several orders of magnitude to generate thousand to million copies of a particular DNA sequence), unigene CD prediction, unigene SSR detection, SNP detection, unigene expression levels and SNPs of each sample were determined. The software used in the information analysis process is shown in Table 1.
Table 1. Software and functions used in information analysis process
|
Information Analysis |
Software Name |
Software Functions |
References |
|
Functional Annotation of Unigene |
Blastn |
NT annotation |
|
|
Blastx or Diamond |
NR, COG, KEGG and SwissProt annotation |
||
|
Blast2GO |
GO annotation |
||
|
InterProScan5 |
InterPro annotation |
||
|
CDS Prediction of Unigene
|
Transdecoder |
Recognition of candidate coding regions in Unigene |
|
|
SSR Detection of Unigene |
MISA |
Detection of Unigene |
|
|
Primer3 |
Primer design for SSR |
||
|
SNP Detection |
HISAT |
Compare clean reads to Unigene |
|
|
GATK |
Detection of SNP |
||
|
Unigene expression calculation |
Bowtie2 |
Compare clean reads to Unigene |
|
|
RSEM |
Calculating the level of gene expression in samples |
Finally, DEGs (differentially expressed genes) between samples were identified by DEGseq, and clustering analysis of DEGs and functional enrichment analysis were carried out.
2.5.4 Clustering analysis, gene ontology analysis and pathway analysis of DEGs
Hierarchical clustering was performed for DEGs using pheatmap, a function of R. The DEGs were classified based on the GO annotation, KEGG annotation result and official classification. We also performed GO functional enrichment using phyper, a function of R. The p value calculating formula in hypergeometric test is:
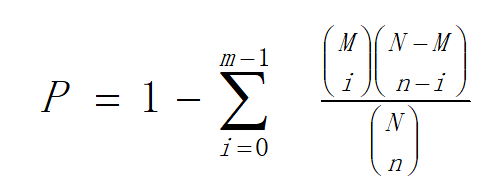
In this formula, N is the number of genes with pathway annotations in all unigenes; M is the number of genes annotated to a particular pathway in all unigenes; n is the number of DEG in N; and m is the number of DEGs annotated to a particular pathway.
The false discovery rate (FDR) for each p value was calculated. In general, the terms for which FDR was no larger than 0.01 are defined as significantly enriched.
2.6 Real-time fluorescence quantitative PCR verification
The effects of vanillin on the expression of various genes of P. fluorescens P07 were determined by RT-qPCR (BIO-RAD CFX Connect™, USA). Briefly, 100 μL of P. fluorescens P07 overnight culture (1.0 OD at 600 nm) was added to 10 mL LB medium (control group) or 10 mL LB medium supplemented with 1.00 mg/mL vanillin (treated group). The test tubes were placed in an incubator at 28 ºC and shaken at 160 rpm for 24 h. The culture was centrifuged (10,000 r/min, 10 min) and the supernatant was removed. Following this, RNA from the bacteria cells was extracted and analyzed.
2.6.1 RNA extraction and detection
After adding 1 mL Trizol, the bacteria were homogenized and placed at 25 ºC for 5 min. Then, 200 mL chloroform was added, and the solution was shaken for 15 s, placed at room temperature for 3 min, and subsequently centrifuged for 15 min (4 °C, 12,000 g). Following centrifugation, the top layer of the colorless liquid (about 50% of the total volume) was transferred to a new RNA-free EP tube. Then, 500 mL 100% isopropanol was added to the supernatant liquid and placed at room temperature for 10 min. Subsequently, this solution was centrifuged for 10 min (4 °C, 12, 000 g). The supernatant was removed and 75% ethanol (prepared with DEPC water) was added and mixed. The resultant solution was centrifuged for 5 min (7,500 g, 4 °C). The ethanol layer was removed and the pellet was dried at room temperature for 5-10 min. Finally, the purified RNA was dissolved in DEPC water and detected by agarose gel electrophoresis.
2.6.2 Reverse transcription of RNA to cDNA
The extracted RNA was reverse transcribed into cDNA using RevertAid First Strand cDNA Synthesis Kit (THERMO SCIENTIFIC, #K1621) and DNase I (THERMO SCIENTIFIC, #EN0521) according to kit instructions.
2.6.3 Real-time quantitative PCR (RT-qPCR) determination
The cDNA solution was diluted and detected by RT-qPCR. The reaction system (total 20 μL) was as follows: 2 × SYBR Green PCR Master Mix: 10 μL; sterilizer ddH2O: 4 μL; F primer: 0.5 μL; R primer: 0.5 μL; cDNA: 5 μL. The PCR conditions were as follows: initial denaturation at 95 °C for 3 min, 95 °C for 10 s, 55 °C for 20 s for annealing, 72 °C for 20 s for extension, and 75 °C 5 s for collecting the fluorescence signal, 40 cycles were run. Melt Curve was obtained at 65.0 to 95.0 °C; increment 0.5 °C. The relative expression of the objective genes was calculated by the 2–△△CT method.
The primers used (10 µM) in the experiment are shown in Table 2.
Table 2. The primers of candidate genes of P. fluorescens P07
|
Gene name |
Gene function |
Primer sequences/5’-3’ |
TM/℃ |
Product length/bp |
|
Unigene 25 |
Alginate biosynthesis protein AlgA |
F:GATGCTGGTCAATGAAGGCC |
59.26 |
142 |
|
R:TACACCGAACAGCACCATCT |
59.03 |
|||
|
Unigene 346 |
LuxR family transcriptional regulator |
F:GAAAACGACCTCATCCGCTG |
59.28 |
115 |
|
R:ACTCGAACCCCAATTGCAAC |
59.04 |
|||
|
Unigene 450 |
acyl-homoserine-lactone acylase |
F:CCGTGACACCTGGGAAGT |
58.85 |
128 |
|
R:TCACTGCCACCACCTGATTA |
58.64 |
|||
|
Unigene 541 |
c-di-GMP phosphodiesterase |
F:GCGTATCGGTGTGGTGATTG |
59.35 |
100 |
|
R:CACCTGGATAATGGGCAAGC |
58.96 |
|||
|
Unigene 729 |
methyl-accepting chemotaxis protein |
F:ACCGAAGACATCACCCTGAG |
59.10 |
142 |
|
R:AGGCTTCCAGGGTCTTTTGT |
59.15 |
|||
|
16S rRNA |
16S ribosomal RNA |
F:GGTATTAGCGTCCGTTTCCG |
58.80 |
124 |
|
R:GGCTAACACATGCAGTCGAG |
59.00 |
2.7 Statistical analysis
The results are expressed as the mean ± standard deviation (SD) and were analyzed through one-way ANOVA by SPSS Statistics 16.0 (SPSS, Inc.) Significant differences are displayed at p < 0.05. All tests were repeated three times.
3.1 Violacein inhibition and β-galactosidase assay
Before violacein inhibition and β-galactosidase assays, the MIC of vanillin against biosensor strains was determined to ensure that any observed inhibitory activity would be not due to bacteriostasis. The MICs of vanillin against C. violaceum CV026 and A. tumefaciens A136 were both 5 mg/mL; 60% DMSO showed no antibacterial activity. The concentration of vanillin used in the violacein inhibition and β-galactosidase assays was under sub-MIC, and the results are shown in Figure. 1. As can be seen from the figure, in the plate of C. violaceum CV026, the plates became purple because it produced purple violacein when there was C6-HSL. In the plate of A. tumefaciens A136, the media became blue when A. tumefaciens A136 encountered C10-HSL and X-Gal. When vanillin below sub-MIC levels was added to the plates, yellow and opaque halos appeared in the plates of C. violaceum CV026 and A. tumefaciens A136. The loss of purple and blue pigmentation indicated that the vanillin had anti-QS activity.
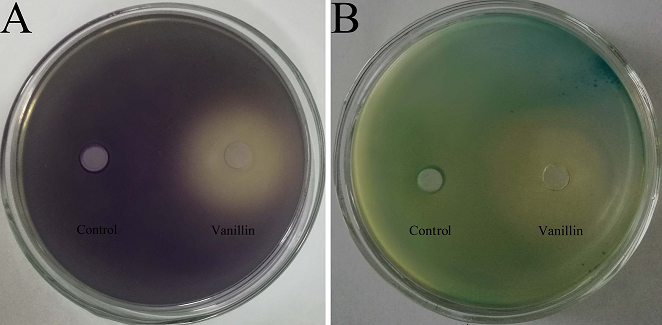
Fig. 1 Violacein inhibition assay and β-galactosidase assay of vanillin. (A) Violacein inhibition assay tested by C. violaceum CV026; (B) β-galactosidase assay tested by A. tumefaciens A136. Control: 60% DMSO.
3.2 Impact of vanillin on swarming motility, biofilm formation, EPS and AHLs
The inhibitory effect of vanillin, which displays potent anti-QS activity, on biofilm formation, swarming motility, and EPS secretion of P. fluorescens P07 was determined. The MIC of vanillin against P. fluorescens P07 was 2 mg/mL. The concentration of vanillin used in all assays was under sub-MIC. The results are shown in Figure. 2.
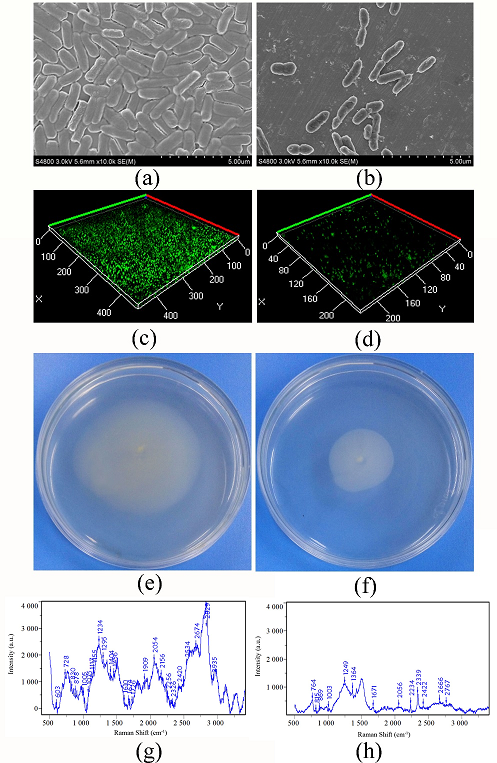
Fig. 2 Effect of vanillin on biofilm formation, swarming motility and EPS of P. fluorescens P07
(a) SEM observation of biofilm of P. fluorescens P07; (b) SEM observation of biofilm of P. fluorescens P07 treated with vanillin; (c) CLSM observation of biofilm of P. fluorescens P07; (d) CLSM observation of biofilm of P. fluorescens P07 treated with vanillin; (e) Swarming motility of P. fluorescens P07; (f) Swarming motility of P. fluorescens P07 treated with vanillin; (g) Raman spectroscopy of EPS of P. fluorescens P07; (h) Raman spectroscopy of EPS of P. fluorescens P07
The SEM images (Fig. 2, a) indicated that untreated P. fluorescens P07 produced a dense biofilm. A large number of bacteria adhered to each other and became encapsulated in the self-secreted extracellular polymer. However, the bacteria dispersed and the biofilm and extracellular polymer content decreased following treatment with vanillin (Fig. 2, b). Confocal laser scanning microscope (CLSM) showed that the color of the biofilm produced by untreated P. fluorescens P07 was deeper than that of the control, indicating that P. fluorescens P07 produced a larger biofilm (Fig. 2, c). When P. fluorescens P07 was treated with vanillin, the color (green) and thickness of the biofilm decreased (Fig. 2, d). The results suggested that vanillin had the ability to inhibit the biofilm formation of P. fluorescens P07. P. fluorescens diffused from the inoculation point to the surrounding area on the swarming plate. The moving area of the untreated bacteria was large, indicating that P. fluorescens has strong mobility. However, the distance of movement decreased when the bacteria were treated with vanillin, indicating that vanillin inhibited the swarming motility of bacteria.
Changes in EPS levels in P. fluorescens P07 treated or untreated with vanillin were tested by Raman spectroscopy (Fig. 2, g and h), and the changes in the chemical constituents were obtained by comparison to the Raman band assignments (Table 1). From the Raman spectra, we ascertained that protein, carbohydrate, DNA, RNA, and lipids were the main chemical compositions of EPS of P. fluorescens P07. When P. fluorescens P07 was treated with vanillin, the Raman peak intensity for the EPS produced by P. fluorescens P07 decreased, indicating that EPS content decreased. Bands in the range of 720-730 cm-1 and 810-820 cm-1, which are typically due to vibrations of adenine, tryptophan, and nucleic acids, respectively, were identified for the EPS. These vibrations were caused by CH2 and C-O-P-O-C linkages. Following vanillin treatment, the levels of these substances in EPS decreased. Between 1200 and 1343 cm-1, bending vibration caused by N-H and C-H groups were identified, which represented protein (amide III) in the EPS. After vanillin treatment, the peak intensity was reduced, indicating that vanillin could inhibit the formation of proteins in EPS. The stretching vibrations between 1855 and 2920 cm-1, caused by CH2, CH3 groups, sporopollenin, and lipids, were allocated. In contrast, the corresponding chemical compounds in the EPS of P. fluorescens P07 treated with vanillin reduced. In addition, the intensity of the spectrum became weaker when fluorescens P07 was treated with vanillin. These results indicated that vanillin could inhibit the production of EPS.
The AHLs secreted by P. fluorescens P07 could be confirmed by comparing to the peak time of standard AHLs by GC-MS. As can be seen in Table 3, P. fluorescens P07 produced six types of AHLs (C4-HSL, C6-HSL, C8-HSL, C10-HSL, C12-HSL and C4-HSL). The total amount of signal molecules produced by P. fluorescens P07 decreased when the bacteria was treated with vanillin under sub-MIC. The result suggested that vanillin had the ability to inhibit the production of signal molecules in P. fluorescens P07.
Table 3. Effect of vanillin on AHLs of P. fluorescens P07
|
AHLs |
Peak Area |
||
|
Control |
0.5 mg/mL vanillin |
1.0 mg/mL vanillin |
|
|
C4-HSL |
15,398±4832 |
401±206 |
5,564±2,821 |
|
C6-HSL |
40,855±2735 |
12,232±2804 |
1,294±354 |
|
C8-HSL |
31,190±6962 |
— |
1,102±275 |
|
C10-HSL |
39,351±3830 |
8,377±1,573 |
— |
|
C12-HSL |
20,450±1758 |
2,726±529 |
3,656±1,933 |
|
C14-HSL |
3,337±593 |
2,755±1642 |
372±267 |
3.3 Effect of vanillin on violacein, 5-bromo-4-chloro-indigo and bacterial growth
As shown in Fig. 3(a) and Fig. 3(b), the violacein production (purple color compound) and 5-bromo-4-chloro-indigo (blue color compound) was measured quantitatively. Vanillin showed a concentration-dependent inhibition in the violacein production in the plate of C. violaceum CV026 and 5-bromo-4-chloro-indigo production in the plate of A. tumefaciens A136. In order to ensure that the decrease of violacein and 5-bromo-4-chloro-indigo production was due to interfering with the signaling of C. violaceum CV026 and A. tumefaciens A136 rather than antibacterial activity, the absorbance of biomass of C. violaceum CV026 and A. tumefaciens A136 at 600 nm was measured. Besides, the effect of vanillin on the bacterial growth of P. fluorescens P07 was also measured (Fig. 3, c). Results showed that, under sub-MIC of vanillin, bacterial growth of C. violaceum CV026, A. tumefaciens A136 and P. fluorescens P07 was not affected by vanillin. The results suggested that the inhibitory activity of vanillin was not due to antibacterial activity.
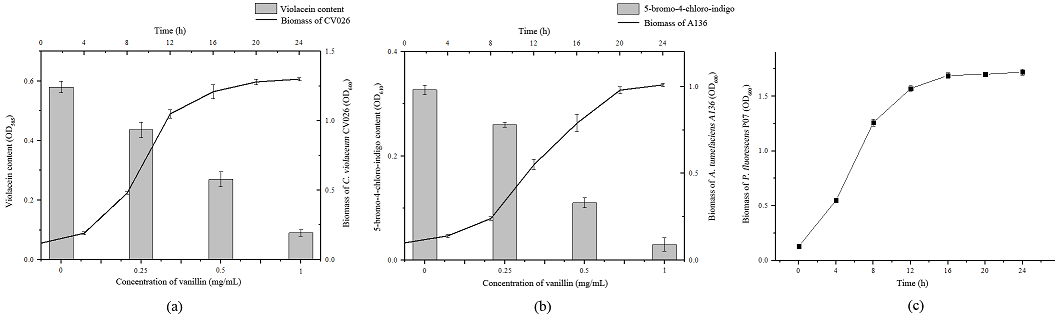
Fig. 3 Effect of vanillin on violacein, 5-bromo-4-chloro-indigo and bacterial growth
3.4 Transcriptome results
The sample transcriptomes were tested using the Illumina HiSeq platform and 13.75 Gb of data were obtained. After assembly and de-redundancy operations, 1,586 unigenes were obtained with a total length of 7,928,528 bp and an average length of 4,999 bp. N50 was 1c5,017 bp and GC content was 60.50%. 7,732 CDS were detected by Transdecoder, and 40 SSRs were found in 33 unigenes. The transcriptome data was uploaded in SRA (SRP241728, https://www.ncbi.nlm.nih.gov/Traces/study/?acc=PRJNA600061
3.5 Detection results of differentially expressed genes
The DEGseq algorithm was used to detect DEGs, and Volcano plot and Heatmap plot were used to display the distribution results of DEGs (Figure. 4).
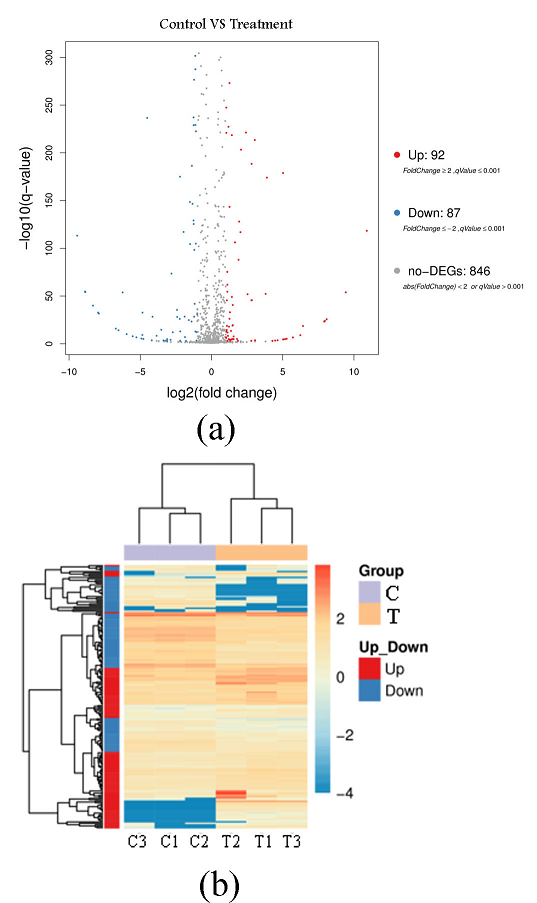
Fig. 4 Volcano plot (a) and pheatmap-plot (b) for the differentially expressed genes of P. fluorescens P07 treated with vanillin and control
C: Control group; T: Treatment group
The volcanic map of the differentially expressed genes in Fig. 4(a), represents up-regulated DEG in red, down-regulated DEG in blue, and non-DEG in black. This figure shows that 179 differentially expressed genes exhibited a qValue < 0.001 and Fold Change (> 2). Among them, 92 differentially expressed genes were up-regulated and 87 were down-regulated following vanillin treatment. There were 846 non-differentially expressed genes. Figure 4(b) is a calorimetric map of differentially expressed genes. The X-axis represents the sample, and the Y-axis represents the differentially expressed genes. The darker the color, the higher the expression level. This figure shows that the color difference in differentially expressed genes between the treatment group and the control group was large, indicating that vanillin treatment has a greater impact on some bacterial genes.
3.6 GO analysis of DEG
DEGs were classified, and enrichment was analyzed according to the three functional classifications of Gene Ontology, i.e. molecular function, biological process and cell components. The results of GO functional classification are shown in Fig. S1 (a). The corresponding results of up-regulated and down-regulated DEG results are shown in Fig. S1 (b).
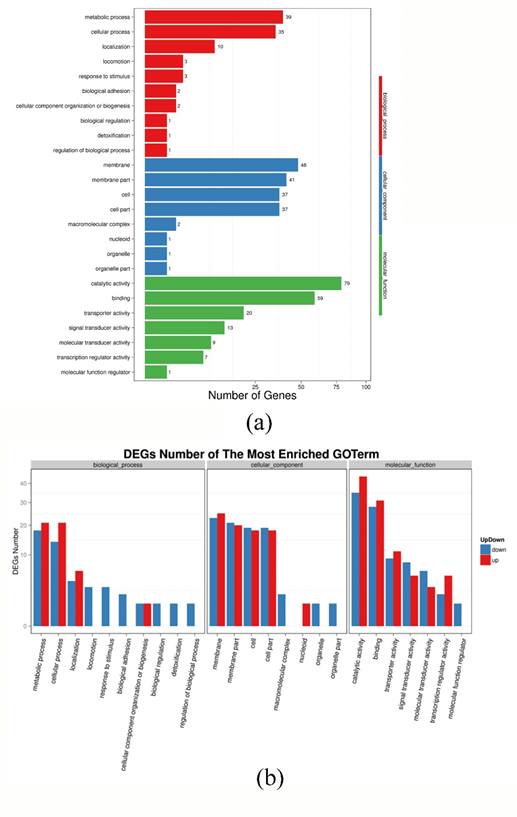
Fig. S1 GO function classification results of the DEGs (a) and statistical results of up regulate and down regulate genes (b) of P. fluorescens P07 treated with vanillin and control
As show in Figure S1 (a), there are 453 DEGs mapped to the GO functional classification. Among them, 97 DEGs were clustered under biological processes, of which 39 were metabolic processes; 168 DEGs were clustered under cellular components; and 188 DEGs were clustered under molecular function. As can be seen from Figure S1 (b), following vanillin treatment, metabolic processes and cellular processes (divided under biological processes) were obviously up-regulated, as were locomotion, response to stimulus, biological adhesion and biological regulation. Catalytic activity, binding, transporter activity and transcription regulator activity were up-regulated, while signal transducer activity and molecular transducer activity were significantly down-regulated.
3.7 Real-time fluorescence quantitative PCR validation results
Real-time fluorescence quantitative PCR (RT-qPCR) was used to detect the influence of vanillin at sub-MIC levels on gene transcription of the Alginate biosynthesis protein AlgA (Unigene 25), the LuxR family transcription regulator (Unigene 346), acyl-homoserine-lactone acylase (Unigene 450), c-di-GMP phosphodiesterase (Unigene 541) and methyl-accepting chemotaxis protein (Unigene 729). 16S rRNA was used as an internal reference gene. Amplification and melting curves of the samples are shown in Fig. S2. The expression differences of related genes were calculated by the △△Ct method. The results are shown in Figure. 5.
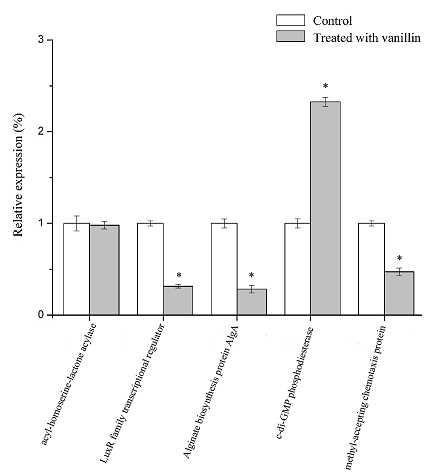
Fig. 5 Effect of vanillin on gene expression in P. fluorescens P07.
Each bar represents mean of three replicates and standard deviations (*, p < 0.05)
As can be seen from the figure, there was no significant difference between Unigene 450 (acyl-homoserine-lactone acylase) treated with vanillin, while the relative expression of Unigene 541 (c-di-GMP phosphodiesterase) increased significantly compared with the control (p<0.05), and the expression of the other genes decreased significantly (p<0.05). The relative expression of Unigene 25, Unigene 346 and Unigene 729 decreased by 71.76%, 68.55% and 52.60%, respectively, compared with those genes untreated with vanillin. The results of RT-qPCR were consistent with those of the transcriptome analysis.
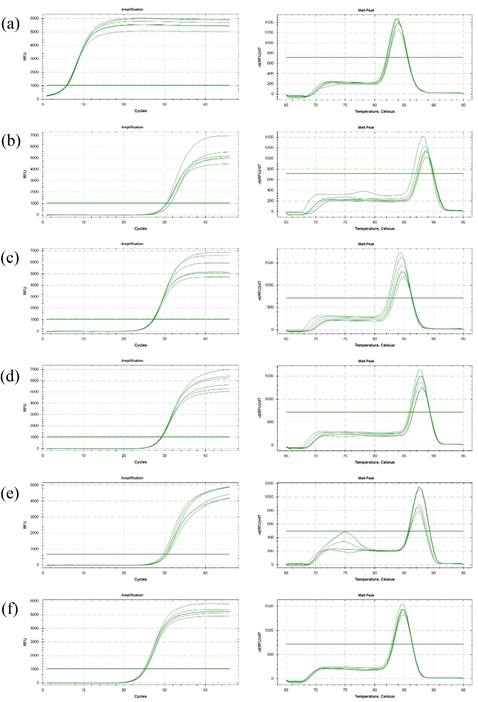
Fig. S2 The amplification and melting curve of real-time quantitative PCR of P. fluorescens P07
(a) Amplification and melting curve of 16S rRNA; (b) Amplification and melting curve of alginate biosynthesis protein AlgA; (c) Amplification and melting curve of c-di-GMP phosphodiesterase; (d) Amplification and melting curve of methyl-accepting chemotaxis protein; (e) Amplification and melting curve of acyl-homoserine-lactone acylase; (f) Amplification and melting curve of LuxR family transcriptional regulator
The results of this analysis showed that no significant difference in the number of genes up-regulated and down-regulated by vanillin treatment, and most identified genes were non-differentially expressed. According to the pathway classification map of differentially expressed genes, the differentially expressed genes of vanillin-treated bacteria were clustered into Amino acid metabolism (13), Carbohydrate metabolism (5), Lipid metabolism (3), Metabolism of cofactors and vitamins (3) and Metabolism of other amino acids (1). After vanillin treatment, the number of up-regulated genes was larger than that of down-regulated genes, probably because that these bacteria initiated more copies of gene expression to adapt to environmental changes caused by vanillin treatment. Based on the results of the GO and KEGG enrichment analyses, the information of DEG related gene function, genes involved in biological metabolism and the mechanism of action could be obtained. GO enrichment analysis showed that the metabolic and cellular processes of P. fluorescens P07 were significantly up-regulated after vanillin treatment, which may be because that bacteria need to express more genes to adapt to environmental changes and maintain their physiological metabolism. The locomotion, biological adhesion, macromolecular complex and signal transducer activity of P. fluorescens P07 were all down-regulated.
After vanillin treatment, biofilm formation of P. fluorescens P07 decreased, which may be related to the down-regulation of its motility and bio-adhesion related genes. Bacteria form biofilm with complex three-dimensional structure through three dynamic processes: initial adhesion, biofilm development and maturation. Adherence to the surface of an object, the first step in biofilm formation, prevents bacteria from being carried away to a harmful environment. Studies have shown that, as an important accessory structure of the bacterial cell surface, energy-producing organelles, such as flagellum or cilia, play an important role in promoting bacterial adherence to object surfaces in the early stages of biofilm formation (Chu and Li, 2003). The ability of bacteria to move at the solid-liquid interface and to attach to solid surfaces are all related to flagellum-mediated mobility; flagella therefore play an important role in the initial formation of biofilm. The stronger the motility of bacteria, the greater biofilm they can form. Bacterial motility also plays a decisive role in the late maturation of biofilm. GO enrichment analysis showed that following vanillin treatment, bacterial locomotion and biological adhesion decreased significantly, which may be because vanillin inhibited bacterial motility and lead to the decline of initial adhesion of biofilm.
After vanillin treatment, the genes FlhA, FlhB, FliF, FlgL and FlgK were all down-regulated. And FlhA, FlhB and FliF of bacterial flagellum were down-regulated after vanillin treatment. The ability of the basal body to fix and drive decreased, which lead to the decrease of bacterial adhesion. At the same time, the FlgL and FlgK genes of the flagellum hook were also down-regulated, resulting in a decline in their ability to connect with the flagellum, resulting in an inadequate driving force of flagellum and eventually a decline in bacterial mobility. Bacterial flagellum motility is affected by bacterial chemotaxis. Bacterial chemotaxis is the response of bacteria to environmental changes. Bacterial chemotaxis is regulated by a two-component system which Methyl-accepting Chemotaxis Protein (MCP) was involved in (Wood et al., 2006). MCP can be distributed in both the periplasm and the cytoplasm through the cell membrane. Amongst these, MCPs in the periplasm can sense the changes of chemical signals existing in the external environment, adjust the motility of bacterial flagellum by regulating downstream two-component signal system, change the direction of flagellum rotation, and finally trigger bacteria to exhibit chemotaxis towards or away from an environmental stimulus. CheA (a histidine kinase) and CheY (a response regulator) are important components of signal transduction in a two-component regulatory system (Hossain M M, 2006). CheA is a sensor kinase in a two-component regulatory system, which can self-phosphorylate in the presence of ATP, also phosphorylating CheY. Bacteria transmit signals from the external environment to the flagellum motor through CheA and CheY to respond accordingly. The transcriptomic data showed that a methyl-accepting chemotaxis protein (Unigene 729), the chemotaxis protein CheA (CL84.Contig4) and the chemotaxis protein CheY (Unigene 538) genes were all down-regulated. The down-regulation of these MCPs resulted in the decrease of sensitivity to signals in the environment. The down-regulation of CheA resulted in the suppression of chemotactic signal transduction, which could not be transmitted to CheY. Since CheY acts directly with the converting protein FliM of flagellum motor, this caused a decrease in bacterial motility. The above results were consistent with the observed decrease in migration area and swarming motility on the plate.
When bacteria attach to the surface of active or inactive substances, they regulate their gene expression and produce a large number of extracellular polymers during the process of growth and proliferation. At this time, the bacterial adhesion to the surface of the object is very strong and irreversible. EPS includes cell secretions, exfoliated cell surface substances, cell autolysate and environmental adsorbents. Individual bacteria can aggregate into microcolonies through extracellular polymers. With the increase of microcolonies, the thickness of biofilm increases, forming a barrier against the adverse environment. Therefore, extracellular polymers secreted by bacteria play a key role in the development of biofilm structure (Norizan et al., 2013).
Cyclic bis (3'-5') diguanylic acid, (c-di-GMP) is a ubiquitous secondary messenger molecule in bacteria. Studies have shown that c-di-GMP can improve the synthesis of cellulose, the primary component of biofilm, c-di-GMP therefore plays an important role in regulating the formation of bacterial biofilm (C., 1999; W., 2001; Kulasekara B R, 2013). Proteases in c-di-GMP metabolism generally contain GGDEF (Gly-Gly-Asp-Glu-Phe) and EAL (Glu-Ala-Leu) domains, which are ubiquitous in all kinds of bacteria (Ross et al., 1987; Jenal, 2000; Simm et al., 2004; R., 2009). For example, in Pseudomonas aeruginosa, c-di-GMP regulates flagellum motility and the production of Psl/Pel polysaccharides by controlling FleQ protein to regulate the formation of biofilm. It also regulates bacterial adhesion by regulating adventitia adhesion protein CdrA and adhesion of biofilm (Sakuragi and Kolter, 2007). The synthesis and degradation of c-di-GMP in bacterial cells is regulated by diguanylate cyclase (DGC) and phosphodiesterase (PDE), respectively. The transcriptome data showed that c-di-GMP phosphodiesterase gene (Unigene 541), the EAL domain protein c-di-GMP phosphodiesterase (Unigene 765), the GGDEF-domain protein c-di-GMP phosphodiesterase (Unigene 188) and cyclic-di-GMP-binding biofilm dispersal mediator protein (Unigene225) were up-regulated treated with vanillin. Up-regulation of PDE expression lead to a decrease in intracellular c-di-GMP concentration and a decrease in biofilm formation. The diffusion ability of biofilm was improved. Bacterial adhesion and polysaccharide synthesis decreased due to the decline of c-di-GMP concentration (R., 2009).
Extracellular polysaccharide is an important component of biofilms. It is composed primarily of alginate, extracellular matrix polysaccharide (Psl) and extracellular polysaccharide (Pel), all of which play an important role in the formation of biofilms. Among them, alginate is the most important component (Hentzer et al., 2001). In the initial stage of the formation of extracellular polymers, the content of alginates is high, which plays a key role in bacterial attachment to the surface of objects.
With the growth and proliferation of bacteria, the secretion of extracellular polymers and biofilm increases. In this process, alginate and some extracellular proteins not only form a network framework to maintain the mechanical stability of biofilm, but the glucuronic acid components in extracellular polysaccharide alginate can also help bacteria absorb trace elements, such as Fe3+ and Zn2+ from the surrounding environment to stimulate growth (Wozniak D J, 2003). Through transcriptome studies, it was found that the Alginate biosynthesis protein AlgA (Unigene 25), the probable alginate O-acetylase AlgI (Unigene 594), Alginate biosynthesis protein 8 (Unigene 645) and the alginate O-acetyltransferase biosynthesis protein AlgX (Unigene 193) were down-regulated after P. fluorescens P07 was treated with vanillin, leading to the decrease in both alginate synthesis and production of EPS. This was consistent with the observation that the Raman spectrum intensity of EPS decreased when bacteria were treated with vanillin.
Bacteria can adhere to object surfaces and gradually develop biofilm, eventually resulting in the formation of a mature biofilm, composed of microcolonies with a high tissue structure. Bacteria can transport nutrients and expel metabolic waste out of cells through water channels existing in microcolonies, which play an important role in preventing space and nutrient deficiency caused by overproliferation of bacteria (Flemming H C, 2010). Due to the regulation of QS system or the influence of external fluid impulse, some bacteria in a mature biofilm can shed and transform into the planktonic growth state. These planktonic bacteria then adhere to the surface of active or inactive objects to form a new biofilm (Wimpenny J, 2000). It can be concluded that the bacterial QS system plays an important role in regulating the maturation of biofilm (Stoodley et al., 2002; Brackman et al., 2009). Juhas et al. discovered that QS system mutant strains of Pseudomonas aeruginosa produced biofilm lacking in complex structure, and also thinner than that of the wild-type strains, and the resistance to antibiotics of mutants was also worse than that of wild type strains (Juhas M, 2005). The transcriptome study showed that after vanillin treatment of P. fluorescens P07, the acyl-homoserine-lactone acylase (Unigene 450) in QS system did not change significantly, while the LuxR family transcriptional regulator (Unigene 346) was down-regulated. The down-regulation of LuxR-type protein gene might result in the decrease of binding ability between LuxR-type protein and signal molecule AHLs in QS pathway, thus, the expression of target genes related to biosynthesis of biofilm might be blocked, which ultimately lead to the decrease of biofilm produced by bacteria. This conclusion was consistent with the GO enrichment analysis observation that signal transducer activity was completely down-regulated. In addition, it was consistent with the phenomenon that the content of biofilm produced by vanillin-treated bacteria decreased, as seen in the SEM study. From the above results, it can be inferred that the inhibitory activity of vanillin on the biofilm of P. fluorescens may be the result of multiple factors. Nam et al. also found that vanillin played a very good role in controlling biofouling in sewage treatment. The biofilm content on the surface of a membrane bioreactor (MBR) decreased by 25% when treated with vanillin (Nam A, 2015).
In this study, swarming motility, biofilm formation, and EPS production of P. fluorescens P07 were inhibited by vanillin, which exhibited strong QS inhibitory activity. Transcriptionomic studies show that the decrease in biofilm production by P. fluorescens P07 when treated with vanillin was probably due to changes in the mobility, adhesion, chemotaxis, EPS, and QS bacterial systems. This study provides a reference for exploring the mechanism of action of the QS system of P. fluorescens and for finding new ways to prolong shelf life and enhance safety of aquatic products.
Funding
This research received no external funding.
Author Contributions
Ting Ding and Yong Li contributed to the conception of the study. Ting Ding performed the data analyses and wrote the manuscript.
Conflict of Interest
All authors declare no conflict of interest.
Abraham, W.R. (2016). Going beyond the control of quorum-sensing to combat biofilm infections. Antibiotics (Basel), 5(1). doi: 10.3390/antibiotics5010003. PMid:27025518
View Article PubMed/NCBIAlain, S., Jennifer, K., Marcella, D. H., Andrea, M. M., Joyce, E. L. (1995). The sigma factor σs affects antibiotic production and biological control activity of Pseudomonas fluorescens Pf-5. Proc. Natl. Acad. Sci. USA. 92, 12255-12259. doi: 10.1073/pnas.92.26.12255. PMid:8618880
View Article PubMed/NCBIAltschul, S.F., Gish, W., Miller, W., Myers, E.W., & Lipman, D.J. (1990). Basic local alignment search tool. J. Mol. Biol. 215(3), 403-410. doi: 10.1016/S0022-2836(05)80360-2. 80360-2
View ArticleAnand, R., Rai, N., & Thattai, M. (2013). Interactions among quorum sensing inhibitors. PLoS One, 8(4), e62254. doi: 10.1371/journal.pone.0062254. PMid:23626795
View Article PubMed/NCBIAnbazhagan, D., Mansor, M., Yan, G.O., Md Yusof, M.Y., Hassan, H., and Sekaran, S.D. (2012). Detection of quorum sensing signal molecules and identification of an autoinducer synthase gene among biofilm forming clinical isolates of Acinetobacter spp. PLoS One 7(7), e36696. doi: 10.1371/journal.pone.0036696. PMid:22815678
View Article PubMed/NCBIArnaut-Rollier, I., De Zutter, L., & Van Hoof, J. (1999). Identities of the Pseudomonas spp. in flora from chilled chicken. Int. J. Food Microbiol. 48(2), 87-96. doi: 10.1016/s0168-1605(99)00038-0. 00038-0
View ArticleBekaert, K., Devriese, L., Maes, S., & Robbens, J. (2015). Characterization of the dominant bacterial communities during storage of Norway lobster and Norway lobster tails (Nephrops norvegicus) based on 16S rDNA analysis by PCR-DGGE. Food Microbiol. 46, 132-138. doi: 10.1016/j.fm.2014.06.022. PMid:25475276
View Article PubMed/NCBIBodini, S.F., Manfredini, S., Epp, M., Valentini, S., & Santori, F. (2009). Quorum sensing inhibition activity of garlic extract and p-coumaric acid. Lett. Appl. Microbiol. 49(5), 551-555. doi: 10.1111/j.1472-765X.2009.02704.x. PMid:19709367
View Article PubMed/NCBIBoziaris, I.S., Stamatiou, A.P., & Nychas, G.J. (2013). Microbiological aspects and shelf life of processed seafood products. J. Sci. Food Agric. 93(5), 1184-1190. doi: 10.1002/jsfa.5873. PMid:22987506
View Article PubMed/NCBIBrackman, G., Hillaert, U., Van Calenbergh, S., Nelis, H.J., & Coenye, T. (2009). Use of quorum sensing inhibitors to interfere with biofilm formation and development in Burkholderia multivorans and Burkholderia cenocepacia. Res. Microbiol. 160(2), 144-151. doi: 10.1016/j.resmic.2008.12.003. PMid:19146953
View Article PubMed/NCBIBuchfink, B., Xie, C., & Huson, D.H. (2015). Fast and sensitive protein alignment using DIAMOND. Nat. Methods 12(1), 59-60. doi: 10.1038/nmeth.3176. PMid:25402007
View Article PubMed/NCBIPotera, C. (1999). Forging a link between biofilms and disease. Science 283(5409), 1837-1839. doi: 10.3390/ijms18061283. PMid:28621716
View Article PubMed/NCBICady, N. C., McKean, K. A., Behnke, J., Kubec, R., Mosier, A. P., Kasper, S. H., Burz, D. S., & Musah, R. A. (2012). Inhibition of biofilm formation, quorum sensing and infection in Pseudomonas aeruginosa by natural products-inspired organosulfur compounds. PLoS One, 7(6), e38492. doi: 10.1371/journal.pone.0038492. PMid:22715388
View Article PubMed/NCBIChu, X., & Li, D. (2003). Cloning, expression, and purification of His-tagged rat mevalonate kinase. Protein Expr. Purif. 27(1), 165-170. doi:10.1016/s1046-5928(02)00591-0. 00591-0
View ArticleConesa, A., Gotz, S., Garcia-Gomez, J. M., Terol, J., Talon, M., & Robles, M. (2005). Blast2GO: a universal tool for annotation, visualization and analysis in functional genomics research. Bioinformatics, 21(18), 3674-3676. doi: 10.1093/bioinformatics/bti610. PMid:16081474
View Article PubMed/NCBICui, X., Harling, R., Mutch, P., & Darling, D. (2005). Identification of N-3-hydroxyoctanoyl-homoserine lactone production in Pseudomonas fluorescens 5064, pathogenic to broccoli, and controlling biosurfactant production by quorum sensing. Eur. J. Plant Pathol. 111, 297-308. doi:10.1007/s10658-004-4171-z.
View ArticleDing, T., Li, T., & Li, J. (2018). Identification of natural product compounds as quorum sensing inhibitors in Pseudomonas fluorescens P07 through virtual screening. Bioorg. Med. Chem. 26(14), 4088-4099. doi:10.1016/j.bmc.2018.06.039. PMid:30100021
View Article PubMed/NCBIDing, T., Li, T., Wang, Z., & Li, J. (2017). Curcumin liposomes interfere with quorum sensing system of Aeromonas sobria and in silico analysis. Sci. Rep. 7(1), 8612. doi: 10.1038/s41598-017-08986-9. PMid:28819178
View Article PubMed/NCBIEl-Sayed, A. K., Hothersall, J., Cooper, S. M., Stephens, E., Simpson, T. J., & Thomas, C. M. (2003). Characterization of the mupirocin biosynthesis gene cluster from Pseudomonas fluorescens NCIMB 10586. Chem. Biol. 10(5), doi:10.1016/s1074-5521(03)00091-7. 00091-7
View ArticleFlemming, H. C., Wingender, J. (2010). The biofilm matrix. Nat. Rev. Microbiol. 8(9), 623-633. doi: 10.1097/MOO.0b013e328334f670. PMid:19940770
View Article PubMed/NCBIGennari, M., Dragotto, F. (1992). A study of the incidence of different fluorescent Pseudomonas species and biovars in the microflora of fresh and spoiled meat and fish, raw milk, cheese, soil and water. J. Appl. Microbiol. 72(4), 281-288. doi: 10.1016/j.micres.2016.05.014. PMid:27664728
View Article PubMed/NCBIHengge, R. (2009). Principles of c-di-GMP signaling in bacteria. Nat. Rev. Microbiol. 7(4), 263-273. doi: 10.3390/ijerph14101196. PMid:28991199
View Article PubMed/NCBIHentzer, M., Teitzel, G. M., Balzer, G. J., Heydorn, A., Molin, S., Givskov, M., & Parsek, M. R. (2001). Alginate overproduction affects Pseudomonas aeruginosa biofilm structure and function. J. Bacteriol. 183(18), 5395-5401. doi: 10.1128/jb.183.18.5395-5401.2001. PMid:11514525
View Article PubMed/NCBIHossain, M. M., Tsuyumu, S. (2006). Flagella-mediated motility is required for biofilm formation by Erwinia carotovora subsp carotovora. J. Gen. Plant Pathol. 72(1), 34-39. doi:10.1007/s10327-005-0246-8.
View ArticleImamura, Y., Yanagihara, K., Mizuta, Y., Seki, M., Ohno, H., Higashiyama, Y., Miyazaki, Y., Tsukamoto, K., Hirakata, Y., Tomono, K., Kadota, J., & Kohno, S. (2004). Azithromycin inhibits MUC5AC production induced by the Pseudomonas aeruginosa autoinducer N-(3-Oxododecanoyl) homoserine lactone in NCI-H292 Cells. Antimicrob Agents Chemother, 48(9), 3457-3461. doi: 10.1128/AAC.48.9.3457-3461.2004. PMid:15328111
View Article PubMed/NCBISybiya Vasantha Packiavathy, I. A., Agilandeswari, P., Musthafa, K. S., Karutha Pandian, S., & Veera Ravi, A. (2012). Antibiofilm and quorum sensing inhibitory potential of Cuminum cyminum and its secondary metabolite methyl eugenol against Gram negative bacterial pathogens. Food Res. Int. 45, 85-92. doi:10.1016/j.foodres.2011.10.022.
View ArticleJenal, U. (2000). Signal transduction mechanisms in Caulobacter crescentus development and cell cycle control. FEMS Microbiol. Rev. 24(2), 177-191. doi: 10.1016/S0168-6445(99)00035-2. 00035-2
View ArticleJuhas, M., Eberl, L., Tummler, B. (2005). Quorum sensing: the power of cooperation in the world of Pseudomonas. Roles of Pseudomonas aeruginosa las and rhl quorum-sensing system in control of elastase and rhamnolipid biosynthesis genes. Environ. Microbiol. 7(4), 459-471. doi: 10.1007/978-3-319-21993-6_4. PMid:26337845
View Article PubMed/NCBIKazemian, H., Ghafourian, S., Heidari, H., Amiri, P., Yamchi, J. K., Shavalipour, A., Houri, H., Maleki, A., & Sadeghifard, N. (2015). Antibacterial, anti-swarming and anti-biofilm formation activities of Chamaemelum nobile against Pseudomonas aeruginosa. Rev. Soc. Bras. Med. Trop. 48(4), 432-436. doi: 10.1590/0037-8682-0065-2015. PMid:26312934
View Article PubMed/NCBIKim, D., Langmead, B., & Salzberg, S. L. (2015). HISAT: a fast spliced aligner with low memory requirements. Nat. Methods, 12(4), 357-360. doi: 10.1038/nmeth.3317. PMid:25751142
View Article PubMed/NCBIKulasekara, B. R.; Kamischke, C.; Kulasekara, H. D.; Christen, M.; Wiggins, P. A.; Miller, S. I. (2013). c-di-GMP heterogeneity is generated by the chemotaxis machinery to regulate flagellar motility. Elife. 2(2), e01402. doi: 10.3389/fmicb.2017.01784. PMid:29033902
View Article PubMed/NCBIKuribayashi, K., Hikata, M., Hiraoka, O., Miyamoto, C., Furuichi, Y. (1988). A rapid and efficient purification of poly(A)-mRNA by oligo(dT)30-Latex. Nucleic Acids Symp. Ser. 19(19), 61-64. doi: 10.3390/ijms19103097. PMid:30308944
View Article PubMed/NCBIKwak, Y. S., & Weller, D. M. (2013). Take-all of wheat and natural disease suppression: A review. Plant Pathol. J. 29(2), 125-135. doi: 10.5423/PPJ.SI.07.2012.0112. PMid:25288939
View Article PubMed/NCBILangmead, B., & Salzberg, S. L. (2012). Fast gapped-read alignment with Bowtie 2. Nat. Methods, 9(4), 357-359. doi: 10.1038/nmeth.1923. PMid:22388286
View Article PubMed/NCBILaue, B. E., Jiang, Y., Chhabra, S. R., Jacob, S., Stewart, G., Hardman, A., Downie, J. A., O'Gara, F., & Williams, P. (2000). The biocontrol strain Pseudomonas fluorescens F113 produces the Rhizobium small bacteriocin, N-(3-hydroxy-7-cis-tetradecenoyl)homoserine lactone, via HdtS, a putative novel N-acylhomoserine lactone synthase. Microbiology, 146, 2469-2480. 10.1099/00221287-146-10-2469. PMid:11021923
View Article PubMed/NCBILi B, Dewey, C. N. (2011). RSEM: accurate transcript quantification from RNA-Seq data with or without a reference genome. BMC Bioinf. 12(1), 323. doi:10.1186/1471-2105-12-323. PMid:21816040
View Article PubMed/NCBILi, T., Wang, D., Ren, L., Mei, Y., Ding, T., Li, Q., Chen, H., & Li, J. (2019). Involvement of exogenous N-acyl-homoserine lactones in spoilage potential of Pseudomonas fluorescens isolated from refrigerated turbot. Front. Microbiol. 10, 2716. doi:10.3389/fmicb.2019.02716. PMid:31849873
View Article PubMed/NCBIGennari, M.; Tomaselli, S.; Cotrona, V. (1999). The microflora of fresh and spoiled sardines (Sardina pilchardus) caugh in Adriatic (Mediterranean) Sea and stored in ice. Food Microbiol. 16, 15-28.doi: 10.1006/fmic.1998.0210.
View ArticleMartins, M. L., Pinto, U. M., Riedel, K., Vanetti, M. C., Mantovani, H. C., & de Araujo, E. F. (2014). Lack of AHL-based quorum sensing in Pseudomonas fluorescens isolated from milk. Braz. J. Microbiol. 45(3), 1039-1046. doi:10.1590/s1517-83822014000300037. PMid:25477941
View Article PubMed/NCBIMcKenna, A., Hanna, M., Banks, E., Sivachenko, A., Cibulskis, K., Kernytsky, A., Garimella, K., Altshuler, D., Gabriel, S., Daly, M., & DePristo, M. A. (2010). The Genome Analysis Toolkit: a MapReduce framework for analyzing next-generation DNA sequencing data. Genome Res. 20(9), 1297-1303. doi: 10.1101/gr.107524.110. PMid:20644199
View Article PubMed/NCBINam, A., Kweon, J., Ryu, J., Lade, H., Lee, C. (2015). Reduction of biofouling using vanillin as a quorum sensing inhibitory agent in membrane bioreactors for wastewater treatment. Membr. Water Treat. 6(3), 189-203. doi: 10.1016/j.cis.2017.11.002. PMid:29129313
View Article PubMed/NCBINorizan, S. N., Yin, W. F., & Chan, K. G. (2013). Caffeine as a potential quorum sensing inhibitor. Sensors (Basel), 13(4), 5117-5129. doi: 10.3390/s130405117. PMid:23598500
View Article PubMed/NCBIOliveira, G. B. de, Favarin, L., Luchese, R. H., & McIntosh, D. (2015). Psychrotrophic bacteria in milk: How much do we really know? Braz. J. Microbiol. 46(2), 313-321. doi:10.1590/s1517-838246220130963. PMid:26273245
View Article PubMed/NCBIQuevillon, E., Silventoinen, V., Pillai, S., Harte, N., Mulder, N., Apweiler, R., & Lopez, R. (2005). InterProScan: protein domains identifier. Nucleic Acids Res. 33(Web Server issue), W116-120. doi: 10.1093/nar/gki442. PMid:15980438
View Article PubMed/NCBIRajmohan, S., Dodd, C. E., & Waites, W. M. (2002). Enzymes from isolates of Pseudomonas fluorescens involved in food spoilage. J. Appl. Microbiol. 93(2), 205-213. doi:10.1046/j.1365-2672.2002.01674.x. PMid:12147068
View Article PubMed/NCBIMcLean, R. J., Pierson, L.S., Fuqua, C. (2004). A simple screening protocol for the identification of quorum signal antagonists. J. Microbiol. Methods. 58(3), 351-360. doi:10.1016/j.mimet.2004.04.016. PMid:15279939
View Article PubMed/NCBIRoss, P., Weinhouse, H., Aloni, Y., Michaeli, D., Weinberger-Ohana, P., Mayer, R., Braun, S., de Vroom, E., van der Marel, G. A., van Boom, J. H., & Benziman, M. (1987). Regulation of cellulose synthesis in Acetobacter xylinum by cyclic diguanylic acid. Nature, 325(6101), 279-281. doi: 10.1038/325279a0. PMid:18990795
View Article PubMed/NCBISakuragi, Y., & Kolter, R. (2007). Quorum-sensing regulation of the biofilm matrix genes (pel) of Pseudomonas aeruginosa. J. Bacteriol. 189(14), 5383-5386. doi: 10.1128/JB.00137-07. PMid:17496081
View Article PubMed/NCBIShaw, P. D., Ping, G., Daly, S. L., Cha, C., Cronan, J. E., Rinehart, K. L., & Farrand, S. K. (1997). Detecting and characterizing N-acyl-homoserine lactone signal molecules by thin-layer chromatography. Proc. Natl. Acad. Sci. U. S. A. 94(12), 6036-6041. doi: 10.1093/jisesa/iex011. PMid:28355477
View Article PubMed/NCBISimm, R., Morr, M., Kader, A., Nimtz, M., & Romling, U. (2004). GGDEF and EAL domains inversely regulate cyclic di-GMP levels and transition from sessility to motility. Mol. Microbiol. 53(4), 1123-1134. doi: 10.1111/j.1365-2958.2004.04206.x. PMid:15306016
View Article PubMed/NCBISperanza, B., Bevilacqua, A., Conte, A., Del Nobile, M. A., Sinigaglia, M., & Corbo, M. R. (2012). Use of desirability approach to predict the inhibition of Pseudomonas fluorescens, Shewanella putrefaciens and Photobacterium phosphoreum in fish fillets through natural antimicrobials and modified atmosphere packaging. Food Bioprocess Technol. 6(9), 2319-2330. doi:10.1007/s11947-012-0889-3.
View ArticleStankowska, D., Czerwonka, G., Rozalska, S., Grosicka, M., Dziadek, J., & Kaca, W. (2012). Influence of quorum sensing signal molecules on biofilm formation in Proteus mirabilis O18. Folia Microbiol. 57(1), 53-60. doi: 10.1007/s12223-011-0091-4. PMid:22198843
View Article PubMed/NCBIStoodley, P., Cargo, R., Rupp, C. J., Wilson, S., & Klapper, I. (2002). Biofilm material properties as related to shear-induced deformation and detachment phenomena. J. Ind. Microbiol. Biotechnol. 29(6), 361-367. doi: 10.1038/sj.jim.7000282. PMid:12483479
View Article PubMed/NCBIThiel, T., Michalek, W., Varshney, R. K., & Graner, A. (2003). Exploiting EST databases for the development and characterization of gene-derived SSR-markers in barley (Hordeum vulgare L.). Theor. Appl. Genet. 106(3), 411-422. doi: 10.1007/s00122-002-1031-0. PMid:12589540
View Article PubMed/NCBIDing, T., Li, T., Wang, Z., Li, J. (2017). Curcumin liposomes interfere with quorum sensing system of Aeromonas sobria and in silico analysis. Sci. Rep. 7(8612). doi: 10.1007/s00253-011-3145-2. PMid:21318358
View Article PubMed/NCBIUntergasser, A., Cutcutache, I., Koressaar, T., Ye, J., Faircloth, B. C., Remm, M., & Rozen, S. G. (2012). Primer3-new capabilities and interfaces. Nucleic Acids Res. 40(15), e115. doi: 10.1093/nar/gks596. PMid:22730293
View Article PubMed/NCBISutherland, I. (2001). Biofilm matrix-an immobilized but dynamic microbial environment. Trends Microbiol. 9(5), 222-227. doi: 10.1093/femsec/fix038. PMid:28334335
View Article PubMed/NCBIWahman, S., Emara, M., Shawky, R. M., El-Domany, R. A., & Aboulwafa, M. M. (2015). Inhibition of quorum sensing-mediated biofilm formation in Pseudomonas aeruginosa by a locally isolated Bacillus cereus. J. Basic Microbiol. 55(12), 1406-1416. doi: 10.1002/jobm.201500268. PMid:26288125
View Article PubMed/NCBIWang, T., Guo, H., Zhang, H., Ren, F., Zhang, M., Ge, S., Luo, H., & Zhao, L. (2019). Dynamics of bacterial communities of lamb meat packaged in air and vacuum pouch during chilled storage. Food Sci. Anim. Resour. 39(2), 209-221. doi: 10.5851/kosfa.2019.e16. PMid:31149663
View Article PubMed/NCBIWimpenny, J., Manz, W., Szewzyk, U. (2000). Heterogeneity in biofilms. FEMS Microbiol. Rev. 4(25), 661-671. doi: 10.1111/j.1574-6976.2000.tb00565.x. PMid:11077157
View Article PubMed/NCBIWood, T. K., Gonzalez Barrios, A. F., Herzberg, M., & Lee, J. (2006). Motility influences biofilm architecture in Escherichia coli. Appl. Microbiol. Biotechnol, 72(2), 361-367. doi: 10.1007/s00253-005-0263-8. PMid:16397770
View Article PubMed/NCBIWozniak D J, W. T. J., Starkey M, Keyser R, Azadi P, O'Toole G A, Parsek M R. (2003). Alginate is not a significant component of the extracellular polysaccharide matrix of PA14 and PAO1 Pseudomonas aeruginosa biofilms. Proc. Natl. Acad. Sci. 100(13), 7907-7912. doi: 10.3390/ijms18061283. PMid:28621716
View Article PubMed/NCBIZhang, C., Bijl, E., Svensson, B., & Hettinga, K. (2019). The extracellular protease AprX from Pseudomonas and its spoilage potential for UHT milk: A review. Compr. Rev. Food Sci. Food Saf. 18(4), 834-852. doi:10.1111/1541-4337.12452.
View ArticleZhang, J., Rui, X., Wang, L., Guan, Y., Sun, X., & Dong, M. (2014). Polyphenolic extract from Rosa rugosa tea inhibits bacterial quorum sensing and biofilm formation. Food Control, 42, 125-131. doi: 10.1016/j.foodcont.2014.02.001.
View Article