Maurice O. Miller, PhD
Department of Physics, University of the West Indies, Mona Campus, Kingston, Jamaica
Email: moneilmiller@gmail.com
© 2019 Sift Desk Journals. All Rights Reserved
VOLUME: 3 ISSUE: 2
Page No: 429-438
Maurice O. Miller, PhD
Department of Physics, University of the West Indies, Mona Campus, Kingston, Jamaica
Email: moneilmiller@gmail.com
Xuan Zha X(sgxycsf@163.com)
Khamphe Phoungthong K(khamphe@hotmail.com)
Maurice Oneil Miller, The impact of coincidence summing corrections in the gamma-ray spectrometry analysis of uncontaminated surface soils(2018)SDRP Journal of Earth Sciences & Environmental Studies 3(2)
In this study, three (3) scenarios were modeled in EFTRAN 4.4.1 and analyzed in SigmaPlot for Version 10.0 to determine quantitatively the impact of the counting geometry (source and detector parameters) on the coincidence summing correction factors used in the analysis of primordial radionuclides in uncontaminated soil samples. The study will also assist gamma spectroscopist to determine when coincidence summing correction may be excluded in the gamma spectroscopy of uncontaminated soils. The materials simulated in this study were typically constituted soil in a polystyrene container (height 21mm and radius 69.5 mm) in contact geometry with a HPGe detector. Additionally, the study examines how these corrective factors, impacted the calculated sample activity measured in Bq/kg. The results of the modeled scenario indicated that the only values of interest were 15.3% for Pb-212 (238.63 keV), 4.11% for Ra-224 (241 keV), and 12.64% Pb-214 (295.17 keV). When the values were summarized by series, the impact on the uranium (1.1%), thorium (6.9%) and actinium series (0%) suggested that the impact was only significant for the thorium series (> 4%). The results of the impact of the counting geometry suggested that the impact on the coincidence summing correction factors were as follows; crystal diameter, maximum of 25% occurring at 969.11 keV (AC-228), and a maximum of 0.5% at 143.76 keV (U-235) for crystal height. The standard deviation of the distribution of changes in the correction factors were 6.8 for crystal diameter and 1.4 for crystal length 50% variation modeling.
Keywords
Coincidence summing corrections, gamma spectroscopy, EFTRAN, SPECTRW
In this research, the primary concern is low level primordial radiation (low counting rate, i.e < 100 counts/sec) from uncontaminated areas measured in contact with the detector, hence only cascade summing is of real significance since random summing impacts the analysis of high activity sources. The phenomenon of coincidence summing has been of interest to many spectrometrists [1-6]. It becomes particularly interesting since many papers have been published examining the radiation profile of the terrestrial environment [7-12]. The uncertainties associated with nuclear decay data have been studied to determine how these uncertainties affect the detection efficiencies in gamma-ray spectrometry performed with HPGe detectors in close geometry with cascading gamma-rays [3].Coincidence summing corrections is generally incorporated in gamma spectroscopy[13-16]. Efficiency calibration and coincidence summing correction were performed for an array of NaI(Tl) detectors developed for in vivo neutron activation analysis [4]. Other analyses included a HPGe detector photopeak efficiency calculation including self-absorption and coincidence corrections for Marinelli beaker sources using compact analytical expressions [15]. Due to the impact of low-level environmental radioactivity, coincidence summing corrections have been used in these study to enhance reported activity concentration results[1, 17]. A number of software is available to assist in mitigating the problems associated with cascading gamma rays [5, 18]. Monte Carlo simulation of several gamma-emitting source and detector arrangements for determining corrections of self-attenuation and coincidence summation in gamma-spectrometry have been performed [16].The key scientific issue to be addressed in this study, is to determine whether the acquisition and application of coincidence summing software is a strict requirement for all scenarios in the analysis of gamma activity concentration in low-level environmental samples usually measured in close proximity to detectors.
Theory
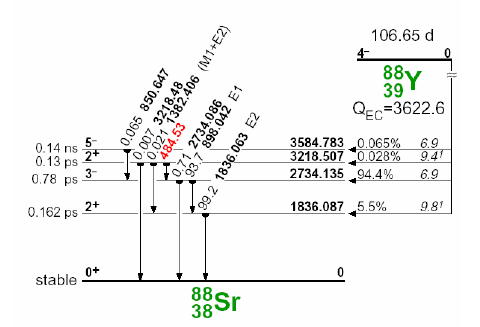
Figure 1 : Decay scheme of Y-88 by electron capture disintegration and excited states of Sr-88 with gamma rays. The relative relative intensities of the gamma rays are located immediately above the transition arrow followed by the gamma-ray energies (keV), in bold type. M1, E1, and E2 multipolarities refers to the magnetic diploe, electric diplole and electric quadopole associated with the decays
Summing effects from cascade (Figure 1) and random/chance summing affects the area under the photopeak for radionuclides of interest. Cascade correction occurs when radionuclides emit multiple cascade gammas in its decay, and these gammas are detected within the resolving time the detector’s counting system. The impact of the cascading effect is not only limited to gammas from the same source but may include X-rays and the 511 keV annihilation photon. Assuming no isomeric states are involved, the lifetime of an intermediate state being so small (0.78 ps), the gammas appear to be emitted in coincidence. If the resolution time of the spectrometry system, is longer than the time delay between the emitted gammas, sum coincidence peaks above and below the expected gammas will occur in the spectrum. In the diagram above, gamma at 1382.406 keV (gamma #1) and 1836.63 keV (gamma #2) will suffer from cascade summing losses while gamma at 3218.48 keV suffers from cascade summing gain. Except for the high energy range where the background is low, these summing peaks are usually lost in the background and continua of the spectra. In gamma spectrometry, is usually determined by the shaping time constant of the liner amplifier.
Assuming two gammas (1 and 2) in coincidence, it can be shown that;
Equation 1- Impact of cascade summing effect
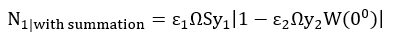
where ε1 and ε2 are the intrinsic peak efficiency of the detector for gammas 1 and 2, Ω is the fractional solid angle subtended by the gamma on the face of the detector, S is the number of source decay over the period of observation, y1 and y2 and are the branching ratios of gammas 1 and 2 respectively, and is a factor that accounts for any angular correlation between the two gamma rays. True coincidence summing correction factor for voluminous sources, as used in this study are computed through Monte Carlo approach summarized as shown below:
Equation 2 - True coincidence summing correction factor for voluminous sources
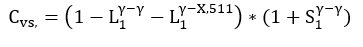
where L1γ-γ and S1γ-γ are losses and gains probability respectively due to cascade summing between decay gamma rays and gamma rays, L1γ-X,511 and is the loss probability between decay gamma rays and X-rays or decay gamma rays and 511keV annihilation photon [19]. The determination of the cascade correcting values, generally acknowledged to be a complex process, is now generated using Monte Carlo modelling application. These values are dependent on the detector efficiency values for the various gammas in cascade, the fractional solid angle subtended by these gamma, their activity, branching ratio, and their angular correlation [20]
Nuclides affected by cascade summing require cascade summing multiplying factor to account for photopeak counts lost or accumulated due to cascade summing. Except for K-40 (at 1460 keV), Cs-137 (at 661.66 keV), Th-234, and Pb-210, all other primordial within the energy range of interest (up to 2MeV), required cascade correction. Figures 2 and 3 shows the decay of K-40 and Cs-137, both of which require no coincidence summing corrections in the gamma spectroscopy of low level environmental samples. In the electron capture decay of K-40 to stable Ar-40, the characteristic gamma energy of 1460.859 keV is not emitted in cascade with any other gamma, nor are any other gammas combined at this energy level. Similarly, in the beta decay of Cs-137 to Ba-137 (Figure 3), the characteristic gamma at 660.661 keV is also similarly unaffected.
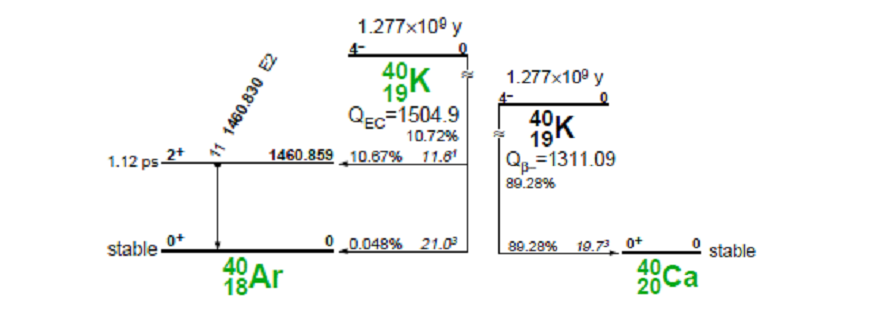
Figure 2 : Electron capture decay of Potassium-40 to Argon-40 resulting in the characteristic electric quadrupole emission (E2) photopeak at 1460.83 keV gamma. Branching ratio 11%. The diagram on the right shows the more probably alternate decay path (89.28%) via beta decay to Ca-40. Diagram courtesy of Table of Isotopes.
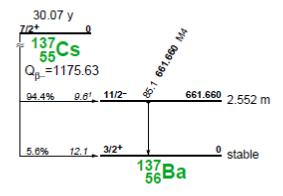
Figure 3: Beta decay of Cs-137 to Ba-137 showing 661.660 gamma with M4 characteristics from excited state of Ba-137. Diagram courtesy of Table of Isotopes.
The determination of the cascade correcting values, generally acknowledged to be a complex process, is now generated using Monte Carlo modelling application. These values are dependent on the detector efficiency values for the various gammas in cascade, the fractional solid angle subtended by these gamma, their activity, branching ratio, and their angular correlation [20]. Monte Carlo methods are used in numerous applications in gamma spectroscopy [17, 21-25].
Monte Carlo methods/experiments refers to a broad class of computational algorithms that rely on repeated random sampling to obtain numerical results. The essence is in the application of randomness to solve problems that might be deterministic in principle. They are often used in physical and mathematical problems and are most useful when it is difficult or impossible to use other approaches. Monte Carlo methods are mainly used in optimization, numerical integration, and generating draws from a probability distribution [26]
In this study the parameters simulated in EFTRAN 4.4.1 reflected a typical counting geometry, soil container, Jamaican soil elemental concentration, and HPGe detector used in the analysis of low level gamma radiation in environmental samples.
Three (3) scenarios were modeled to determine quantitatively the impact of the counting geometry (source and detector parameters) on the coincidence summing correction factors used in the analysis of primordial radionuclides in uncontaminated soil samples. Additionally, the study examines how omission of the corrective factors, impact the calculated sample activity measured in Bq/kg. Due to complexities related to the counting geometry employed, errors below 4% is not significant [27]. Additional coincidence summing correction values were generated based on the following two (2) scenarios:
In Scenario #3, the impact of non-inclusion of correction factor on the main primordial radionuclides in environmental samples were examined.
The method of sample preparation (by the same author) has been described in a previous publication[28]. From the analysis of these 68 samples, a representative sample (from an area called Black River in Jamaica) was selected. This sample was analyzed in SPECTRW[29] and displayed as shown in Figure 4.
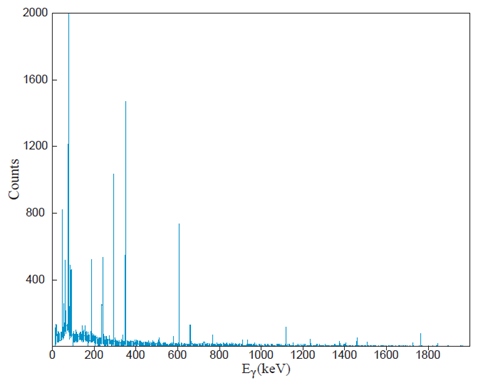
Figure 4 : Spectral Analysis of uncontaminated soil sample from the Black River area of St. Elizabeth, Jamaica.
The International Atomic Energy Agency (IAEA) funded Efficiency Transfer and Coincidence Summing Corrections for Gamma-ray Spectrometry (EFTRAN 4.4.1) software code was used to generate the cascade correcting values. EFFTRAN is a free tool for efficiency and true coincidence summing corrections in environmental gamma-ray spectrometry, and was developed with partial financial support of the IAEA Coordinated Research Project no. 1471 [5, 30]. EFTRAN was selected dues to its availability and the rigorous testing its use in the gamma spectroscopy [5, 30] .The detector and source setup (in EEFTRAN) is shown in figures 3 and 4 respectively. The study simulates a polystyrene cylindrical container (Table 1) filled with uncontaminated hydrated surface soil sample (Table 2), and in contact geometry with a typical HPGe detector (Table 3).
Table 1 : Source parameters setup in EFFTRAN.
|
Configuration items |
Specification |
|
|
|
|
Sample filling height (mm) |
21.00 |
|
Sample material |
Hydrated soil |
|
Container diameter (mm) |
69.50 |
|
Container bottom thickness (mm) |
1.00 |
|
Container wall thickness (mm) |
1.00 |
|
Container material |
polystyrene |
|
Container-to-absorber gap (mm) |
0.00 |
The hydrated soil simulated represents a typical soil sample from Jamaica. The hydrated soil used in this study was constituted as shown in Table 2
Table 2 : Elemental concentration of simulated soil used in this study.
|
Elements |
Percentage by mass (%) |
|
Al |
7.14 |
|
O |
55.81 |
|
Fe |
3.15 |
|
Si |
31.52 |
|
C |
1.21 |
|
H |
1.17 |
Table 3 : Detector parameters setup in EFFTRAN.
|
Configuration items |
Specification |
|
|
|
|
Crystal diameter (mm) |
71.00 |
|
Crystal length (mm) |
29.86 |
|
Bulletization radius (mm) |
0.00 |
|
Top dead layer (mm) |
1.00 |
|
Side dead layer (mm) |
1.00 |
|
Crystal hole (cavity) length (mm) |
40.00 |
|
Crystal hole (cavity) diameter (mm) |
10.00 |
|
Crystal material |
Germanium |
|
End cap (housing) diameter (mm) |
80.00 |
|
End cap (housing) thickness (mm) |
1.00 |
|
End cap (housing) material |
Aluminum |
|
Window thickness (mm) |
1.00 |
|
Window-to-crystal gap (mm) |
5.00 |
|
Window material |
Aluminum |
|
Mount cup (holder) thickness (mm) |
0.00 |
|
Mount cup (holder) material |
Aluminum |
|
Absorber diameter (mm) |
100.00 |
|
Absorber thickness (mm) |
0.00 |
|
Absorber material |
copper |
The values of the five (5) generated coincidence summing correction factor in Table 4 are based on the typical experimental setup for measuring primordial radiation in uncontaminated surface soil. The default correction value refers to experimental setup shown in Tables 1-3, while the values generated by Scenarios # 1 and 2 (previously described) are shown. Table 5 refers to Scenario # 3 and is the impact (on the measured activity of the sample) of not applying the default coincidence summing correction factor.
Table 4 : Scenario #1 and #2 and default coincidence summing correction factor data
|
|
|
|
Scenario # 1 |
Scenario # 2 |
||
|
Isotope |
Energy |
Default Correction Factor |
50% crystal diameter |
50% crystal length |
50% Source diameter |
50% source height |
|
K-40 |
1460.81 |
1 |
1 |
1 |
1 |
1 |
|
CS-137 |
661.65 |
1 |
1 |
1 |
1 |
1 |
|
TL-208 |
583.191 |
1.1531 |
1.0453 |
1.1099 |
1.1767 |
1.1752 |
|
TL-208 |
860.564 |
1.039 |
1.0114 |
1.0257 |
1.0431 |
1.0418 |
|
BI-212 |
727.17 |
1.0383 |
1.0119 |
1.0281 |
1.0438 |
1.0434 |
|
PB-212 |
238.625 |
1.0002 |
1.0001 |
1.0001 |
1.0002 |
1.0002 |
|
BI-214 |
609.312 |
1.1263 |
1.037 |
1.0894 |
1.1457 |
1.1443 |
|
BI-214 |
1120.287 |
1.1466 |
1.043 |
1.1078 |
1.1692 |
1.168 |
|
BI-214 |
1764.494 |
0.99751 |
0.99962 |
0.9992 |
0.99692 |
0.99696 |
|
PB-214 |
295.213 |
0.99942 |
0.99972 |
0.99929 |
0.99932 |
0.99928 |
|
PB-214 |
351.921 |
1.0012 |
1.0004 |
1.0009 |
1.0014 |
1.0014 |
|
RA-224 |
241 |
1.0003 |
1.0001 |
1.0003 |
1.0004 |
1.0004 |
|
RA-226 |
186.211 |
1.0002 |
1 |
1.0001 |
1.0002 |
1.0002 |
|
AC-228 |
338.32 |
1.0319 |
1.0093 |
1.02 |
1.0352 |
1.0347 |
|
AC-228 |
911.6 |
1.0318 |
1.0105 |
1.0257 |
1.036 |
1.036 |
|
AC-228 |
969.11 |
1.0317 |
1.0104 |
1.0257 |
1.0359 |
1.0359 |
|
PA-234 |
131.3 |
1.0212 |
1.0078 |
1.0199 |
1.0238 |
1.024 |
|
PA-234 |
880.5 |
1.1206 |
1.0387 |
1.1004 |
1.1374 |
1.138 |
|
PA-234 |
883.24 |
1.2416 |
1.0739 |
1.2001 |
1.2785 |
1.2803 |
|
PA-234 |
946 |
1.0975 |
1.0305 |
1.0775 |
1.1107 |
1.1106 |
|
TH-234 |
63.29 |
1 |
1 |
1 |
1 |
1 |
|
U-235 |
143.76 |
1.0095 |
1.0035 |
1.009 |
1.0107 |
1.0108 |
Table 5: Scenario # 3 showing percentage change in sample activity when of coincidence summing correction factor was omitted.
|
Isotope |
Energy (keV) |
Activity |
% Change in Activity |
|
U235 |
143.76 |
4.038 |
0.00 |
|
Ra226 |
186.21 |
74.961 |
0.00 |
|
Pb212 |
238.63 |
5.649 |
15.27 |
|
Ra224 |
241 |
52.613 |
4.11 |
|
Pb214 |
241.91 |
43.083 |
0.00 |
|
Pb214 |
295.17 |
69.155 |
12.64 |
|
Pb214 |
351.9 |
70.579 |
0.00 |
|
Tl208 |
583.19 |
6.025 |
0.00 |
|
Bi214 |
609.32 |
70.72 |
0.00 |
|
Cs137 |
661.66 |
5.806 |
0.00 |
|
Bi212 |
727.33 |
15.086 |
0.00 |
|
Bi214 |
768.36 |
62.942 |
0.00 |
|
Bi214 |
934.06 |
63.286 |
0.00 |
|
Ac228 |
968.97 |
9.577 |
0.00 |
|
Bi214 |
1120.28 |
72.582 |
0.11 |
|
Bi214 |
1155.19 |
99.546 |
0.00 |
|
Bi214 |
1238.11 |
66.307 |
0.00 |
|
Bi214 |
1377.65 |
79.593 |
0.00 |
|
K40 |
1460.83 |
62.316 |
0.00 |
The percentage variation between the default values and the scenarios (done in Excel) were input into Sigma Plot, from which the graphs (in the Results and Discussion section) were generated.
Scenario #1 – Crystal Geometry Variation
Scenario #1 models the impact of 50% reduction in crystal diameter and length on the coincidence correction factor.
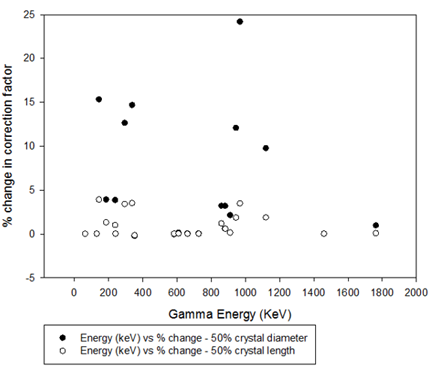
Figure 5: Composite diagram showing error (percentage deviation from true value) introduced in true coincidence summing factor due to error in the crystal diameter and length.
Figure 5 shows that the error in the crystal geometry (especially the crystal diameter) has a significant impact on the true value of the coincidence summing factor. In the case of crystal diameter, a maximum variation of approximately 25% occurred across the gamma energy range of interest 60 – 2000 keV. This maximum value occurred at 968.97 keV and corresponds to the actinium isotope AC-228. In the case of crystal length, a maximum variation of approximately 3.9 % occurred across the gamma energy range of interest 60 – 2000 keV. This maximum value occurred at 143.76 keV and corresponds to the uranium isotope U-235. Unlike variation due to changes in the crystal diameter, the variations due to crystal lengths were contained within 0 to 5%. The study concludes that variations in crystal length were not significant on the derived value of the coincidence summing factor. The standard deviation of the distribution for crystal diameter and length were 6.8 and 1.4 respectively. The rationale for the greater impact of crystal diameter versus length is due to the decreased interaction area (of gamma rays) associated with diameter and not length. The maximum impact at 968.97 is likely due to the relatively high branching ratio of 16.2% for Ac-228.
Scenario # 2 – Source Geometry Variation
Scenario #2 models the impact of a 50% reduction in source container diameter and height on the coincidence correction factor.
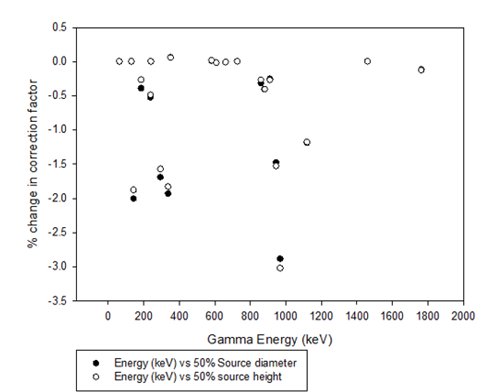
Figure 6: Composite diagram showing error (percentage deviation from true value) introduced in True Coincidence Summing Factor due to error in the source geometry (50% reduction in diameter and height)
Figure 6 shows that the error in the source container’s diameter and height, did not have a significant impact on the true value of the coincidence summing factor. In this case a maximum variation of approximately 3% occurred across the gamma energy range of interest 60 – 2000 keV. This maximum value occurred at 968.97 keV and corresponds to the actinium isotope AC-228. The standard deviation of the distribution (for both source diameter and height) was 0.8. The values here suggest that the impact of the source geometry variation (up to 50%), was not significant (< 4%). The rationale for this result is probably because the gamma rays leaving the source and arriving at the face of the detector were not significantly impacted by the geometry changes.
Figure 7 is a composite of Scenarios #1 and #2. Table 3 summarizes the variation.
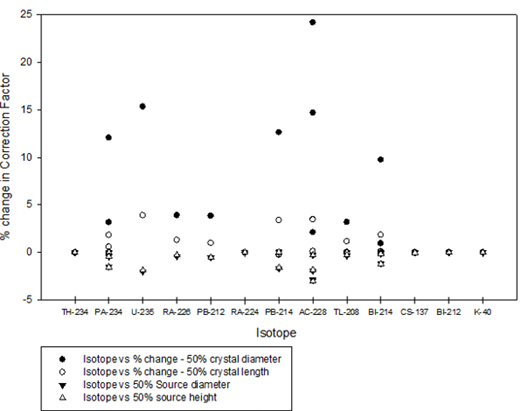
Figure 7: Composite diagram showing error (percentage deviation from true value) introduced in True Coincidence Summing Factor due to error in the crystal and source geometry errors.
Table 6 : Summary of variation in measurement geometry
|
Scenario |
Range (% Deviation from Default) |
Standard Deviation |
Impact |
|
50% reduction in source container diameter |
2.9 |
0.8 |
Not significant |
|
50% reduction in source container height |
3.0 |
0.8 |
Not significant |
|
50% reduction in crystal diameter |
24.2 |
6.8 |
Significant |
|
50% reduction in crystal length |
3.9 |
1.4 |
Not significant |
Scenario # 3 – Variation between application of summing factor
In Table 3, the change in isotope activity (Bq/kg) is shown when no summing correction factor was applied. The values of interest were 15.3% for Pb-212 (238.63 keV), 4.11% for Ra-224 (241 keV), and 12.64% Pb-214 (295.17 keV). When diagrammatically represented (in Figure 8), it shows that the significant impacts only occur in the energy range 200 – 300 keV.
Table 7: Percentage change in soil sample activity (Bq/kg) due to the absence of coincidence summing.
|
Isotope |
Energy (keV) |
Activity (Bq/kg) |
% Change in Activity |
|
U235 |
143.76 |
4.038 |
0.00 |
|
Ra226 |
186.21 |
74.961 |
0.00 |
|
Pb212 |
238.63 |
5.649 |
15.27 |
|
Ra224 |
241 |
52.613 |
4.11 |
|
Pb214 |
241.91 |
43.083 |
0.00 |
|
Pb214 |
295.17 |
69.155 |
12.64 |
|
Pb214 |
351.9 |
70.579 |
0.00 |
|
Tl208 |
583.19 |
6.025 |
0.00 |
|
Bi214 |
609.32 |
70.72 |
0.00 |
|
Cs137 |
661.66 |
5.806 |
0.00 |
|
Bi212 |
727.33 |
15.086 |
0.00 |
|
Bi214 |
768.36 |
62.942 |
0.00 |
|
Bi214 |
934.06 |
63.286 |
0.00 |
|
Ac228 |
968.97 |
9.577 |
0.00 |
|
Bi214 |
1120.28 |
72.582 |
0.11 |
|
Bi214 |
1155.19 |
99.546 |
0.00 |
|
Bi214 |
1238.11 |
66.307 |
0.00 |
|
Bi214 |
1377.65 |
79.593 |
0.00 |
|
K40 |
1460.83 |
62.316 |
0.00 |
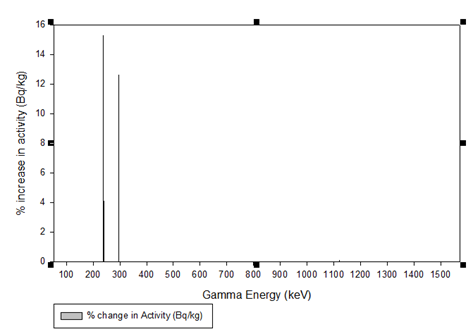
Figure 8 :Percentage change in activity (Bq/kg) in primordial radionuclides in uncontaminated soil samples due to the absence of coincidence summing factor.
The SPECTRW analytical software used in this study, summarizes the primordial energy range (0 to 2000 keV) as Cs-137, K-40, along with the uranium, thorium and actinium series. The impact of not applying the correction factor is shown in Table 4 and Figure 9.
Table 8: Impact on percentage change in summary activity of primordial radionuclides in soil samples due to coincidence summing error. In this case no summing was compared to summing application.
|
Summary |
% Change in Activity |
|
Cs-137 |
0 |
|
K40 |
0 |
|
Uranium Series |
1.1 |
|
Thorium Series |
6.9 |
|
Actium Series |
0 |
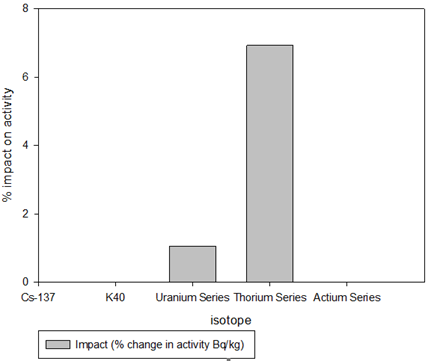
Figure 9: Impact of not applying the coincidence correction factor on concentration activity of K-40, the uranium, thorium and actinium series of Observation of Table 6 and Figure 9 concludes that the impact of coincidence correction factor is zero for Cs-137, K-40 and the Actium series, and not significant (<10%) for the uranium (1.1%) and thorium series (6.9%).
Table 9: Summary of variation in measurement geometry
|
Scenario |
Range (%) |
Standard Deviation |
Impact |
|
50% reduction in source container diameter |
2.9 |
0.8 |
Not significant |
|
50% reduction in source container height |
3.0 |
0.8 |
Not significant |
|
50% reduction in crystal diameter |
24.2 |
6.8 |
Significant |
|
50% reduction in crystal length |
3.9 |
1.4 |
Not significant |
The study concludes that in general, the non-inclusion of coincidence summing correction factors will not significantly impact the results of gamma spectrometry of individual isotopes in uncontaminated surface soils if the energy range 200 – 300 keV is omitted. The isotopes that are significantly affected are Pb-212 at 238.63 keV, Ra-224 at 241 keV, and Pb-214 at 295.17 keV. When the isotopes are organized by series, the absence of cascade summing factors will only impact the thorium series; no impact will occur on the uranium and actinium series. While source container geometry will not have a significant impact on the generated coincidence summing correction factors, the crystal geometry (especially crystal diameter) will have a significant impact.
The significance of this study is that the gamma spectroscopy of uncontaminated surface soils may omit coincidence summing corrections, if the energy range of interest is beyond 300 keV or the series of interest is the uranium and actinium. This study is limited to uncontaminated surface soils measured in a laboratory.
Wielopolski L, Song Z, Orion I, Hanson AL, and Hendrey G (2005) Basic considerations for Monte Carlo calculations in soil. Applied Radiation and Isotopes 62: 97-107. PMid:15498691
View Article PubMed/NCBIKnoll GF (2009) Radiation Detection and Measurement. John Wiley and Sons.New York:
Hernández F,El-Daoushy F (2003) Accounting for incomplete charge collection in Monte Carlo simulations of the efficiency of well-type Ge-detectors. Nuclear Instruments and Methods in Physics Research Section A: Accelerators, Spectrometers, Detectors and Associated Equipment 498: 340-351. 02080-6
View ArticleCanberra (2009) Genie 2000 3.2 Spectroscopy Software - Customization Tools V3.2:
Sima O (2000) Software for the Computation of Detection Efficiency and of Coincidence Summing Effects Including Neutron Self-Shielding. Journal of Radioanalytical and Nuclear Chemistry 244: 669-673.
View ArticleSima O (1996) Applications of Monte Carlo calculations to gamma-spectrometric measurements of environmental samples. Applied Radiation and Isotopes 47: 919-923. 00087-5
View ArticleHaase G, Tait D, and Wiechen A (1993) Monte Carlo simulation of several gamma-emitting source and detector arrangements for determining corrections of self-attenuation and coincidence summation in gamma-spectrometry. Nuclear Instruments and Methods in Physics Research Section A: Accelerators, Spectrometers, Detectors and Associated Equipment 329: 483-492. 91284-T
View ArticleAbbas MI (2001) HPGe detector photopeak efficiency calculation including self-absorption and coincidence corrections for Marinelli beaker sources using compact analytical expressions. Applied Radiation and Isotopes 54: 761-768. 00308-0
View ArticleZhang W, Mekarski P, Lam J, and Ungar K (2010) A Geant4 Monte Carlo method for synthesizing radioxenon beta-gamma coincidence spectra. Journal of Radioanalytical and Nuclear Chemistry 286: 235-240.
View ArticleEl-Gharbawy HA, Metwally SM, Sharshar T, Elnimr T, and Badran HM (2005) Establishment of HPGe detector efficiency for point source including true coincidence correction. Nuclear Instruments and Methods in Physics Research Section A: Accelerators, Spectrometers, Detectors and Associated Equipment 550: 201-211.
View ArticleAerial fallout map confirms soil radiation levels (video) (2011)
Inter Atomic Energy Agency, ALMERA Proficiency Test on the Determination of Radionuclides In Spinach, Soil and Water, in IAEA Analytical Quality in Nuclear Applications No. IAEA/AQ/32009, IAEA: Vienna.
Ramola RC, Gusain GS, Badoni M, Prasad Y, Prasad G, and Ramachandran TV (2008) (226)Ra, (232)Th and (40)K contents in soil samples from Garhwal Himalaya, India, and its radiological implications. J Radiol Prot 28: 379-85. PMid:18714132
View Article PubMed/NCBISchoorl JM, Boix Fayos C, de Meijer RJ, van der Graaf ER, and Veldkamp A (2004) The 137Cs technique applied to steep Mediterranean slopes (Part I): the effects of lithology, slope morphology and land use. CATENA 57: 15-34.
View ArticleFacchinelli A, Magnoni M, Gallini L, and Bonifacio E (2002) 137Cs Contamination from Chernobyl of Soils in Piemonte (North-West Italy): Spatial Distribution and Deposition Model. Water, Air, and Soil Pollution 134: 339-350.
View ArticleRoussel-Debel S, Renaud P, and Métivier J-M (2007) 137Cs in French soils: Deposition patterns and 15-year evolution. Science of The Total Environment 374: 388-398. PMid:17258289
View Article PubMed/NCBIZhu H, Venkataraman R, Menaa N, Mueller W, Croft S, and Berlizov A (2008) Validation of gamma-ray true coincidence summing effects modeled by the Monte Carlo code MCNP-CP. Journal of Radioanalytical and Nuclear Chemistry 278: 359-363.
View ArticleVidmar T EFFTRAN – A Free Tool for Efficiency Transfer and True Coincidence Summing Corrections in Environmental Gamma-Ray Spectrometry (2012).
Byun SH, Prestwich WV, Chin K, McNeill FE, and Chettle DR (2004) Efficiency calibration and Coincidence Summing Correction for a 4π NaI(Tl) detector array. Nuclear Instrumentation and Methods in Physics Research Section A: Accelerators, Spectrometers, Detectors and Associated Equipment 535: 674-685. 01469-X
View ArticleGasparro J, Hult M, Johnston P, and Tagziria H (2006) The effect of Uncertainties in Nuclear Decay Data on Coincidence Summing calculations for Gamma-ray Spectrometry. Czechoslovak Journal of Physics 56: D203-D210.
Sima O,Arnold D (2000) Accurate computation of coincidence summing corrections in low level gamma-ray spectrometry. Applied Radiation and Isotopes 53: 51-56. 00113-5
View ArticleLee M, Park TS, and Woo J-K (2008) Coincidence summing effects in gamma-ray spectrometry using a Marinelli beaker. Applied Radiation and Isotopes 66: 799-803. PMid:18430578
View Article PubMed/NCBIVenkataraman R, Croft S, and Russ WR (2005) Calculation of peak-to-total ratios for high purity germanium detectors using Monte-Carlo modeling. Journal of Radioanalytical and Nuclear Chemistry 264: 183-191.
View ArticleD'Alberti F,Forte M, Calibration of a HPGe detector for in-situ gamma spectrometry: a comparison between a Monte Carlo based code and an experimental method, in Radioactivity in the Environment. E.S. Simopoulos, Editor. 2005, Elsevier. p. 198-206.
McNamara AL, Heijnis H, Fierro D, and Reinhard MI (2012) The determination of the efficiency of a Compton suppressed HPGe detector using Monte Carlo simulations. Journal of Environmental Radioactivity 106: 1-7. PMid:22304994
View Article PubMed/NCBIKroese DPB, T.; Taimre, T.; Botev, Z. I. ( 2014) Why the Monte Carlo method is so important today. WIREs Computational Statistics: 386–392.
Jovanović S, Dlabač A, Mihaljević N, and Vukotić P (1997) ANGLE: A PC-code for Semiconductor Detector Efficiency Calculations. Journal of Radioanalytical and Nuclear Chemistry 218: 13-20.
View ArticleMiller M,Voutchkov M (2014) Evaluation of Gamma Activities of Naturally Occurring Radioactive Materials in Uncontaminated Surface Soils of Jamaica. Journal of Radioanalytical and Nuclear Chemistry
View ArticleKalfas CA, Axiotis M, and Tsabaris C (2016) SPECTRW: A software package for nuclear and atomic spectroscopy. Nuclear Instruments and Methods in Physics Research Section A: Accelerators, Spectrometers, Detectors and Associated Equipment 830: 265-274.
View ArticleVidmar T, Çelik N, Cornejo Díaz N, Dlabac A, Ewa IOB, Carrazana González JA, Hult M, Jovanović S, Lépy MC, Mihaljević N, Sima O, Tzika F, Jurado Vargas M, Vasilopoulou T, and Vidmar G (2010) Testing Efficiency Transfer Codes for Equivalence. Applied Radiation and Isotopes 68: 355-359. PMid:19892558
View Article PubMed/NCBI