Kang Qun
kangqun@hubu.edu.cn
© 2019 Sift Desk Journals. All Rights Reserved
VOLUME: 5 ISSUE: 1
Page No: 1-12
Kang Qun
kangqun@hubu.edu.cn
Zhao Jinhui1, He Chao2, Yang Zhe1, Deng TianTian1,Hou ChangPing1,Kang Qun1*
1 College of Resources and Environment, Hubei University,Wuhan,430062
2 Wuhan University School of Resources and Environmental Science,Wuhan,430072
Kang Qun, Zhao Jinhui, He Chao, Yang Zhe, Deng TianTian, Hou ChangPing, The transmission and distribution regulation of the urban black carbon aerosol in the middle reach of Yangtze River(2019)Journal of Earth Sciences & Environmental Studies 5(1) pp:1-12
This paper uses the software Meteoinfolab, track analysis, correlation analysis, multiple model fitting and other methods, analyses of black carbon aerosol data from the middle reaches of the Yangtze River from July 2015 to June 2016. The results show as followed: The monthly mean mass concentration of black carbon aerosol in Wuhan areas is (3911±2100) ng/m3,with the maximum mean in January and the minimum in July. Its spatial distribution law is showing a decreasing trend from the central city to suburban area and surrounding areas. The meteorological factors such as wind direction, wind speed and visibility had great influence on the black carbon concentration. The correlations between PM2.5, PM10, CO, SO2 and BC were high, and the correlation coefficient was the highest in winter and lowest in spring. The back trajectory indicates that the summer air mass mainly from the northern region of China, the fall air group mainly from the Mediterranean region, the winter air masses mainly from Europe, Mongolia - Siberia high effect, will be part of the transfer to the pollution along the Yangtze River, together with the local bureau of pollutant source, the average concentration of carbon black is the highest level of the year. In spring, the upper air masses middle reaches of the Yangtze River mainly come from the far source, and the middle and low air masses come from the near source and the local source.
Key Words: Black carbon aerosol; Spatial and temporal distribution; Trajectory analysis; Correlation analysis; Wuhan; Model fitting
Black carbon aerosol is one of the important elements in the atmosphere, mainly from the incomplete combustion of Carbonaceous Substances. Distributed rather unevenly around the world, black carbon aerosol has strong absorption of solar radiation from visible light to infrared spectrum, wider than greenhouse gases. It may change cloud reflectivity, indirectly affects the radiation balance between the earth and the atmosphere, thereby leading atmospheric warming; It provides activated carrier for pollutants, and accelerates the process of heterogeneous conversion and gas-particle conversion; It may increase the turbidity, and change the atmospheric visibility. And black carbon aerosol would alter the vertical effects and the stability of regional atmosphere, thereby casting impacts on the atmospheric circulation and water circulation between different regions. Black carbon aerosol plays significant parts both in atmospheric physical and chemical reaction process and atmospheric optical process, some researches hold that black carbon aerosol is a potential impact factor of global warming. Therefore, studies on black carbon aerosol attract much attention from researchers from various countries, among which the resource emissions, the spatial and temporal distribution regulation and the climate and environmental effects have been research focuses.
In order to master and manage the emission of black carbon, at present there are three (3) lists of global emission of black carbon, namely Aerocom list, SPEW list and ACCMIP list[13-14]. However, there exists underestimation of the surface atmospheric optical thickness and the concentration of black carbon in these lists[15]. Many scholars thereby make model improvement, for example, Wang Rong, from Peking University, established the PKU-BC-2007 list, based on the independently developed Global Database of Combustion Source, using the emission factor database of black carbon with independent measure or simulated forecasts, as a result, it shows that the high value area of the global black carbon emission places mainly in East Asia, South Asia, the middle and south areas of Africa and the Middle East[17]. And the issue of black carbon emission in China has aroused many scholars’ attention,and they make the emission lists of black carbon aerosol in Mainland China[18], on the basis of which the 0.5°×0.5° spatial distribution map of the black carbon emission in China is generated, showing that the black carbon aerosol in air in China is mainly distributed in South China, North China and the Yangtze River regions[19], and Liaoning Province, Shangdong Province, Hebei Province, Henan Province, Shanxi Province, Jiangsu Province, Anhui Province and Hubei Province have high emissions.
At present, there are few studies on the trajectory analysis of air pollutants in the middle reaches of the Yangtze River. There is a lack of quantitative research on the temporal spatial distribution and source area composition of BC in this area.Therefore, this paper, exemplified by Wuhan City in Hubei Province, analyzes the transmission and distribution regulation of the black carbon aerosol, and further studies the key reasons and effects of the generation of black carbon aerosol in Wuhan central urban area, playing a practical role in the exploration of the spatial and temporal distribution of black carbon in the middle reach of Yangtze River. At the same time, it provides reference data for the combined control of combined air pollution prevention and control of the urban agglomeration in the middle reaches of the Yangtze River.
1. Sample collection and data source
1.1. Sampling site
This paper selected the middle reaches of the Yangtze River in Wuhan area as the study area, in order to avoid the interference of BC near the distance from the pollution source, selected the city green parks as sampling points (including the Hanyang Liberation Park, Zhongshan Park, Qiaokou park, Changqing Park, Yellow Crane Tower scenic spot, East Lake scenic area, Shahu Park, Shimen peak Park, South Canal Garden a total of 10 sampling points), their locations are shown in Fig.1.
1.2. Sampling instrument
The sampling instrument is the AE-51 black carbon aerosol monitoring instrument by American Magee Scientific Company, and through continuous record(except power off or membrane change), the data are preserved in hard disc or external computer every five (5) minutes.
1.3. Sample collection and data processing
The one-year collection time is from July 2015 to June 2016.According to the validity of the sample data statistics demanded by the environmental air quality standard, there are at least 60 daily values evenly distributed every year, 5 daily value evenly distributed every month, total to six hundred (600) samples of black carbon aerosol, of which twenty-six (26) samples are invalid, so the sample validity in this study is 95.67%.In order to decrease the fierce fluctuations of the observed value caused by the instability of the instrument or the workers in the data station, the original observed data are pre-treated by five-spot triple smoothing, and then generate the hourly mean by the smoothed five-minute average data, then applied in the subsequent data analysis.
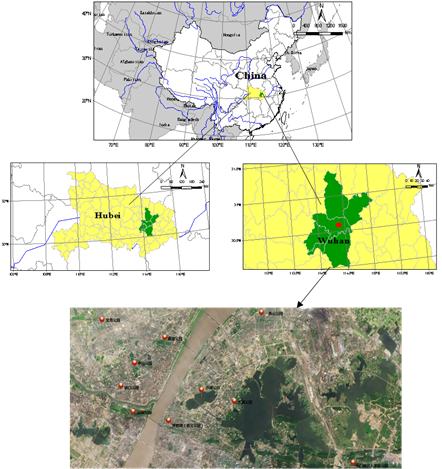
Fig.1 Distribution of Sampling Points in Central Urban Area of Wuhan
Wind speed, visibility, temperature and pressure data are derived from the global data assimilation system provided by http://www. meicmodel.org/, which represents the conventional meteorological data serving the HYSPLIT model. The relevant air pollutants (PM2.5, PM10, SO2, NO2, O3, CO) data were selected from the air quality data released by(http://www.whepb.gov.cn/) Wuhan Environmental Protection Bureau website.
1.4. Analysis method
The statistical methods used in this paper are correlation analysis, regression analysis and multiple models fitting analysis. Meanwhile, the HYSPLIT multi point forward trajectory model is used to analyze the transmission path of BC for trajectory analysis.
The HYSPLIT model is a professional model for the analysis and calculation of the transport, diffusion and settlement trajectory of atmospheric pollutants[20], reflecting the characteristics of the air flow. In this study, the target latitude and longitude is set at 30.55° E and 114.32° N, the simulation range is 0-10000m, and the average flow field in the atmospheric boundary layer is 500m height[21]. It can not only represent the characteristics of air flow (wind), but also reduce the impact of the ground friction on[22] .
2. Analysis and Discussion
2.1 Time variation of BC in the middle reaches of the Yangtze River
2.1.1 Time variation of BC in Wuhan
(1) Diurnal variation characteristics
According to the continuous observation data of BC in Wuhan area from July 2015 to June 2016, 81% of the data is distributed in the range of 2000~6000ng/m3. As shown in Fig.2, there is a better trend of centralization.
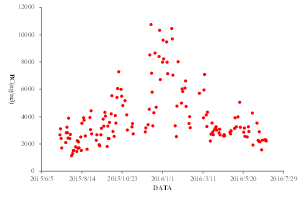
Fig.2 Time Series of the Mass Concentration of BC in Wuhan City
(2) Features of Monthly Variation
The average BC concentration of BC in each month was found in Figure 3, showing a single peak distribution. In January, the concentration was the highest, 7403ng/m3, and the lowest in July, 2354ng/m3.
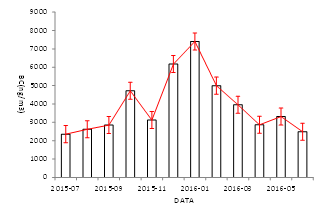
Fig.3 Monthly Variation of the Mass Concentration in Wuhan City
(3) Features of Quarterly Variation
The seasonal distribution of BC mass concentration is the highest in winter, followed by autumn and spring, and lowest in summer, which is basically consistent with the variation rule of BC mass concentration monthly average in every month.
2.1.2 Time variation of BC in the middle reaches of the Yangtze River
(1) Comparison with some foreign cities
The daily mean of BC mass concentration in Wuhan was 3911 (1135~10742) ng/m3, compared with some cities in other countries (Table.1), and at the middle low level.
Table.1 Contrast results of BC concentration in foreign observation stations
|
Observation Point |
Type |
Time |
Average Mass Concentration(ug/m-3) |
|
Puṇyanagara(India)[23] |
Urban Area |
2005-2010 |
3.58±1.55 |
|
Paris(France)[24] |
Urban Area |
2010 |
1.66 |
|
New York(USA) Mayville[25] |
Suburban Area |
2006-2010 |
0.38 |
|
Canada[26] |
Halifax |
2012 |
1.8 |
|
Swedan[27] |
Urban Area |
2007 |
1.4 |
|
City of New York(USA)[28] |
|
2004.01.12-2004.02.05 |
1.38 |
|
Dakar (the Republic of Senegal)[29] |
|
2008.06-2009.07 |
10.5±3.5 |
|
New Delhi(India) [30] |
|
2011.01-2011.12 |
6.7±5.7 |
|
Kathmandu(Nepal)[31] |
|
2009.05-2010.04 |
8.6±4.4 |
|
Wuhan(PRC)(this study) |
Central City |
2014.12-2016.6 |
3.91±2.1 |
(2) Comparison with some cities in China
The seasonal characteristics of BC aerosol are affected by the composition of the emission sources and the seasonal changes in the meteorological factors. The high BC concentration in winter is related to the increase of human activities related to family heating and other adverse weather conditions such as inversion and high stability in winter. The low concentration of BC in summer may be related to frequent atmospheric convection, which is similar to the seasonal variation of BC concentration observed in Nanjing and Hefei (Fig.4). The black carbon concentration in Nanjing[32] is mostly lower than 7000ng/m3, and the average concentration is 221-24686 ng/m3 per hour, with an annual average value of 4157 ng/m3, reaching the lowest in June, July and August. Xiaolin Zhang[33] observed the mass concentration of BC in Hefei from June 2012 to May 2013, the monthly mean from 2 to 1 ug/m3 in July 2012 and 6 to 2.6 ug/m3 in January 2013. The average BC mass concentration in Hefei was the highest in winter, 2 times higher than that in summer, followed by autumn and spring.
This result is the same as the time variation characteristics of BC concentration in the Yangtze River Delta and the Pearl River Delta region. Verma[34] studied the time variation of black carbon in the Pearl River Delta region of Guangzhou, and revealed that the black carbon concentration in summer is 47002300ng/m3.B.L. Zhuang[32] carried out a continuous measurement of BC in Nanjing city in 2012. It was found that BC had obvious seasonal characteristics, high in spring and autumn and low in summer, and more than 75% data samples were between 1000-6000ng/m3.This result is the same as the change of BC concentration time[35] in the Yangtze River Delta, and the winter is high, summer is low, and the fluctuation of autumn and spring season is more intense. That autumn and winter haze frequent season, the lower atmospheric boundary layer, the wind speed is small and the stability of the weather more, temperature inversion phenomenon, is not conducive to the spread of pollutants such as particulate matter BC, resulting in higher concentrations of BC. The meteorological factors (wind direction and precipitation) in summer are conducive to the diffusion, and the concentration is low.
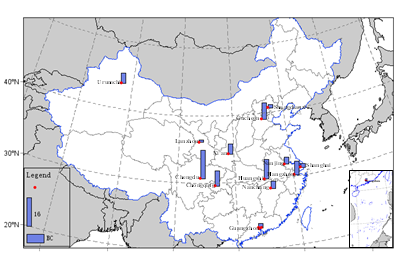
Fig.4 The Comparison of the Observed Result of the BC Aerosol in Different Domestic Cities
2.2 Vertical spatial distribution of mass concentration of black carbon in the middle reaches of the Yangtze River
As the height layer changes, the mass concentration of black carbon also changes, as shown in Fig.5.
As Fig.5 shows, the mass concentration of black carbon changes with the level. Fig.2 is based on MEIC model data cluster on the resolution of 0.25°×0.25°, and the mass concentration of black carbon at levels of 1.000hPa, 0.9950hPa, 0.9870hPa, 0.9700hPa is respectively shown in Fig 5(a), Fig 5(b), Fig 5(c), Fig 5(d). In Fig.5, from 1.000hPa to 0.9700hPa, with the increase of height, the spatial distribution scale of the mass concentration of black carbon and the average mass concentration decrease gradually.
In Fig.5(a), at 1.000hPa, the spatial distribution of the black carbon is wide, mainly in Wuhan Urban Area and its surrounding areas, the mass concentration of which reaches 200g/s in Wuhan City region, and 60-80g/s, 40-60 g/s, 40-60 g/s, 20-40 g/s respectively in Caidian region, Huangpi region, Jiangxia region and Hannan region. The nearer the regions is from Wuhan central city, the lower the mass concentration of black carbon is in the surrounding regions.
The Fig.5(b) shows the spatial distribution of the mass concentration of black carbon at the 0.9950hPa. In Fig.5(b), the highest mass concentration of black carbon comes in the central city, reaching 10g/s, and 2-5g/s in surrounding regions like Caidian, Jiangxia, Hannan; except Daye and Xiantao, the surrounding cities and counties has little black carbon distribution.
In Fig.5(c), at 0.9870hPa, the mass concentration of black carbon is higher in Wuhan central urban area and its near regions, and other regions have distribution of the mass concentration of black carbon, arriving at 1g/s.
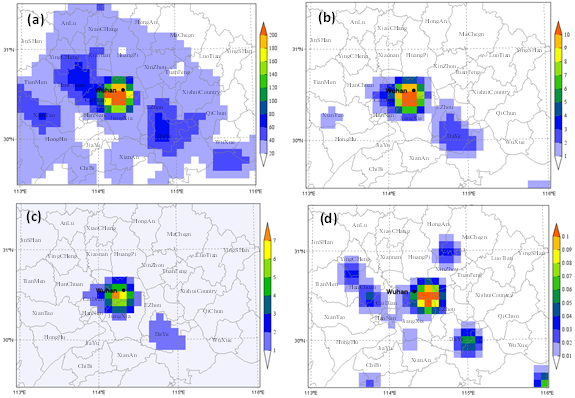
Fig.5 Vertical spatial distribution of mass concentration of BC in Wuhan area (unit: g/s) (a)1.000hPa;(b)0.9950hPa;(c)0.9870hPa;(d)0.9700hPa
The Fig.5(d) shows the spatial distribution of mass concentration of BC at 0.9700 hPa. Compared to Fig.5(a), Fig.5(b), Fig.5(c), the mass concentration of BC in Fig.5(d) clearly reduces. With the high height from the ground, the wind speed over the studied region is higher than the other three levels, therefore, the black carbon aerosol in space will spread to the surroundings, whose mass concentration is between 0.01g/s and 0.03g/s, while the mass concentration of BC in Wuhan central urban area is between 0.09g/s and 0.1g/s.
From the above analysis, the mass concentration of BC in Wuhan shows a decreasing trend in the spatial distribution from the central urban area to the suburban area and the surrounding area. There is great discrepancy in the mass concentration of BC between different levels: the mass concentration of BC is largest near atmospheric surface, and the mass concentration of BC gradually decreases with the increase of height. It is explained that BC substance, a kind of air suspension, can begin the deposition process in the vertical direction with dry deposition and wet deposition of the atmosphere, therefore, the above distribution regulation is found in vertical direction.
2.3 Analysis of the Meteorological Effect on Mass Concentration of BC
This paper chooses the data of WD, WS, VSB, T and AP to represent the conventional meteorological data of Wuhan region, and make relevant analysis with the observed data of BC from July, 2015 to June, 2016.
2.3.1 The Relationship between the Mass Concentration of BC and WD and WS
The Relationship Between the Mass Concentration of BC and WD and WS is shown in Fig.6.
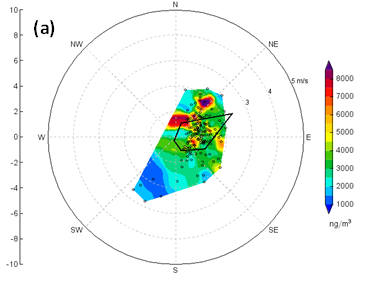
Fig.6 The Distribution of the Relationship Between the Mass Concentration of BC and WD and WS(Unit: ng/m³)
When the WD is north-northeast, and the WS 2m/s, the mass concentration of BC is up to its peak, more than 8000ng/m3; when the WD is north-northwest and the WS 1m/s, the mass concentration of BC is 7000 to 8000ng/m3; the mass concentration of BC is in concentrated distribution of 3000 to 4000 ng/m3 when the WS is 1 to 2m/s; and when the WD is southwest-south, and the WS 2 to 3m/s, the mass concentration of BC is at its bottom of 1000ng/m3.
With the increase of wind speed, BC is diluted and its mass concentration decreases. Therefore, there is a negative correlation between BC and local small wind speed, that is, BC emission sources are easy to enrich BC pollutants under relatively stable weather conditions. Ramachandran and Rajesh[36] also noted the negative correlation between BC and wind speed in the urban area of Ahmedabad, India.
2.3.2 The Relationship between the Mass Concentration of BC and the Other Meteorological Factors
At the significance level of 0.01, BC is highly relevant with T, VSB and AP, the correlation coefficient of which is respectively -0.626, -0.529, 0.523, shown in Table.2.
Table. 2 The Analysis of the Correlation Between BC and T, VSB and AP
|
|
BC |
T |
AP |
VSB |
|
|
BC |
Pearson Correlation |
1 |
-.626** |
.523** |
-.529** |
|
Significance(bilateral) |
/ |
.000 |
.000 |
.000 |
|
|
N |
152 |
152 |
152 |
152 |
|
|
T |
Pearson Correlation |
-.626** |
1 |
-.914** |
.241** |
|
Significance(bilateral) |
.000 |
/ |
.000 |
.003 |
|
|
N |
152 |
152 |
152 |
152 |
|
|
AP |
Pearson Correlation |
.523** |
-.914** |
1 |
-.083 |
|
Significance(bilateral) |
.000 |
.000 |
/ |
.309 |
|
|
N |
152 |
152 |
152 |
152 |
|
|
VSB |
Pearson Correlation |
-.529** |
.241** |
-.083 |
1 |
|
Significance(bilateral) |
.000 |
.003 |
.309 |
/ |
|
|
N |
152 |
152 |
152 |
152 |
|
Note:* represents the significant correlation (bilateral) at level 0.05;**represents the significant correlation (bilateral) at level 0.01.
Then the correlation coefficient between BC and T, VSB and AP in different seasons is analyzed with the result shown in Table.3.
Table 3. The Correlation Coefficients Between AP, VSB and T
|
Season |
Correlation Coefficient |
||
|
Between BC and AP |
Between BC and VSB |
Between BC and T |
|
|
Summer |
0.333 |
-0.712 |
-0.291 |
|
Autumn |
0.103 |
-0.516 |
-0.074 |
|
Winter |
-0.107 |
-0.698 |
-0.099 |
|
Spring |
0.463 |
-0.426 |
-0.338 |
The largest absolute values of the correlation coefficient between BC and T and AP are in spring, and the largest one between the mass concentration of BC and VSB is in summer and winter. Compared with winter, spring has higher temperature, lower AP, more precipitation and lower mass concentration of BC, but the winter does otherwise. The comprehensive effect between this variation and the seasonal correlation between pollutant and BC leads to the feature of temporal variation that the mass concentration of BC is higher in winter and lower in spring.
It indicates that, in meteorological factors, the VSB has the biggest influence on the mass concentration of BC, and this is identical with that PM2.5 in pollutant is the main influence on the mass concentration of BC.
2.4 The Correlation Analysis between Other Air Pollutant
The correlation Analysis is made between the Observed Data of BC from July, 2015 to June, 2016 in Wuhan region and the data of pollutant(PM2.5、PM10、SO2、NO2、O3、CO) during the same time. The result shows that BC is all positively correlated with PM2.5, moderate positive correlated with PM10, CO, SO2, NO2, and moderate negative with O3, the correlation coefficients of which are 0.863, 0.657, 0.647, 0.518, 0.466, -0.366 respectively.
It is inferred that the source of BC aerosol is mainly from the human activities, specially including kinds of fuel combustion source, the mobile source typical of motor vehicle exhaust. Yet under certain conditions, the O3 in the air is apt to chemical reaction with O, NO, NO2 and others, and then NO2 is consumed while the O3 increases, in other words, the variation tends of O3 and NO2 is contrary.
Table.4 correlation coefficient of BC and other pollutants in different seasons, the correlation between BC and PM2.5, PM10 and CO is higher in autumn and winter, and lower in spring and summer, with the highest one in winter and the lowest one in spring. This variation is identical with the seasonal distribution trend of the mass concentration of BC aerosol, which further shows that PM2.5, PM10 and CO are the main sources of BC aerosol in Wuhan urban area.
Table. 4 The Correlation Coefficients between BC and PM2.5, PM10 and CO
|
season |
Correlation coefficients |
||
|
Between BC and PM2.5 |
Between BC and PM10 |
Between BC and CO |
|
|
summer |
0.81 |
0.73 |
0.36 |
|
autumn |
0.60 |
0.66 |
0.70 |
|
winter |
0.89 |
0.67 |
0.81 |
|
spring |
0.63 |
0.55 |
0.33 |
In summer, winter and spring, the correlation coefficient between BC and PM2.5 is the largest among the three, indicating that PM2.5 has a greater contribution to BC concentration. In autumn, the correlation coefficient between BC and CO is the largest, which is 0.7. Currently, the correlation coefficient between BC and PM2.5 is the lowest among the three.
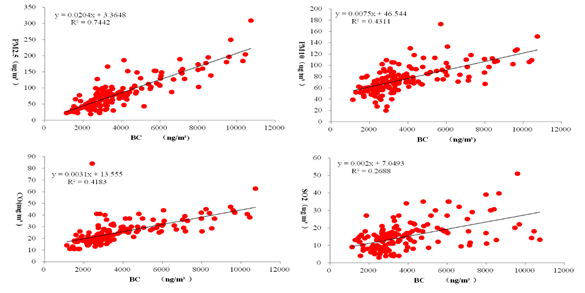
Fig.7 correlation analysis of mass concentration of BC and main air pollutants (a)BC and PM2.5;(b)BC and PM10;(c)BC and CO;(d)BC and SO2
BC and CO are interconnected by combustion process, so their changes are similar, showing a positive correlation (Table.4), indicating that common combustion sources are carried by similar atmospheric circulation. The air quality is relatively cold in winter / autumn, which leads to the better correlation between BC and CO, and the depth of the mixed layer is relatively shallow.
There is a negative correlation between black carbon and ozone, and Chao Chen[31] is considered to be mainly related to solar radiation. The intensity of solar radiation affects the intensity of convection in the atmosphere, which indirectly affects the mass concentration of black carbon. When the solar radiation is strong, the black carbon aerosol is not easy to gather because of the convection in the atmosphere, and the strong solar radiation can also promote the formation of O3.
2.4.2 The Modeling Analysis Between BC and Other Air Pollutants
Making BC the dependent variable and PM2.5, PM10, CO, O3, SO2, NO2 the independent variable, this paper studies the linear relation between them by using the SPSS multiple linear stepwise regression analysis. Use 11 models to make contrast, namely, the linear model, the logarithmic model, the reciprocal model, the quadratic model, the cubic model(the parabolic model), the composite model, the power function model, the S-shaped model, growth model, exponential model and the logistic model, of which the model with the largest correlation coefficient is chosen.
(1) The Model Analysis of the Individual Pollutant
Putting the data of PM2.5 and BC into the SPSS leads the corresponding summary of model and parameter estimates and the regression equation model diagram, shown in Fig.8.
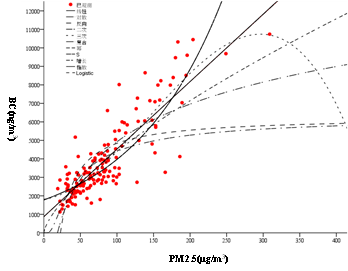
Fig.8 Regression Equation Models between BC and PM2.5
In the models, the largest R2, 0.755, is obtained by the cubic model, and the F value is 152.036, P value is 0.00 consistent with the test, and the expression is followed as:
Y=4.922X3+0.271X2+0.001X+1817.59 (1)
Y refers to BC, X to PM2.5
The same way tells that the correlation between BC and PM10 and CO both use the cubic model, where the R2 is the largest that is, the fitting degree is the best. The expression is followed as:
Y=-179.966X3+2.803X2-0.01X+5588.061 (2)
Y refers to BC, X to PM10
Y=-160.752X3+11.229X2-0.11X+2454.995 (3)
Y refers to BC, X to CO
(2) The Modeling Analysis of the Pollutants
The regression equation can be built, where X1 refers to PM2.5, X2 to PM10, X3 to SO2, the multiple linear regression equation over the model is followed as:
Y=1493.322+43.623X1-24.505X2+40.12X3 (4)
After T test, the probability (P) values of b1, b2 and b3 are 0.000, 0.000 and 0.003, respectively. According to the given significance of 0.10, they all have significant significance. At the same time, the VIF value is less than 10, the empiric value (Neteretal, 1985), and the multiple collinearity of the variables in the equation are not obvious.
2.5 Using backward trajectory analysis of the source and path of BC in the middle reaches of the Yangtze River
In addition to local pollution sources, black carbon pollution in a region is also related to external pollution sources. In certain weather conditions, foreign pollutants will be transported to the area with the air flow, affecting the level of black carbon concentration. Therefore, the representative dates of the period with heavier black carbon pollution in the four seasons of July 17, October 17, January 17, 2016 and April 17, 2015 are selected, and the mixed single particle Lagrange comprehensive trajectory Mode (HYSPLIT4) on Wuhan air block motion trajectory analysis to understand the BC source and path. Fig. 9 shows the 168h retrograde trajectory in different regions of Wuhan. Among them, the red, blue and green represent the back trajectory of 100m, 500m and 750m respectively.
The summer air masses mainly come from the northern part of China and the Yangtze River, where the air pollutants near Hebei, Shaanxi, Shanxi, Anhui and Henan are concentrated. The autumn air masses mainly come from the Mediterranean region and pass through the regions of Inner Mongolia, Shanxi in the northwest of Central Asia, Henan and other places to reach the middle reaches of the Yangtze River region; The air mass in winter mainly came from Europe. Affected by the high pressure of Mongolia and Siberia, part of the pollution along the way was transported to the middle reaches of the Yangtze River. Combined with the local bureaucratic pollutants, the average concentration of black carbon was at the highest level in the whole year. The spring mid-high altitude air masses in the middle reaches of the Yangtze River mainly come from the far-source, low-medium air masses come from near-source and local source. The result is similar to the result of B.L. Zhuang [32], both of which are inland cities. In 2012, the air mass in Nanjing mainly came from long distance transport in the northeast. Xiaolin Zhang et al. [33] carried out a trajectory analysis of BC in Hefei from June 2012 to May 2013 and found that there are mainly three types of black carbon pollution from local areas, from the North China Plain to long-distance transportation from the Yangtze River Delta.
BC was measured continuously in Wuhan in July 2015 to June 2016. Compared with inland cities such as Nanjing and Hefei, the BC concentration was lower than that in some domestic cities.
BC has obvious seasonal, high in winter and low in summer;The BC concentrations are in normal distribution, over 81% of the data samples are between 2000-6000 ng/m3, the lowest frequency appears in the summer and the high concentration appears in the winter; When the wind direction is north-northeast and the wind speed is 2m/s, the mass concentration of black carbon is the largest and greater than 8000ng/m³. When the wind direction is north-northwest and the wind speed is 1m/s, the mass concentration of black carbon is 7000-800ng/m³; When the wind speed is 1-2m/s, the concentration of black carbon is concentrated in the range of 3000-4000 ng/m³. When the wind direction is southwest and southwest, the minimum concentration of black carbon is 1000ng / m³ when the wind speed is 2-3m/s.
The absolute values of the correlation coefficients between BC and temperature and air pressure all appeared in spring, while those with the highest visibility appeared in summer and winter.
Autumn and winter BC and PM2.5, PM10, CO correlation is high, but in the spring and summer correlation is low.
In general, the summer air masses in the middle reaches of the Yangtze River come mainly from the waters around the North Pacific, fall from northern and eastern Canada, from the Arctic regions near Russia and Canada in winter, and from spring to spring when the air masses are scattered mainly from Canada.
Supported by the National natural science foundation project (No. 41401559)
Qin S G, Tang J, Wen Y P. Black carbon aerosol and its significance in climate change research [J]. Atmosphere,2001,27(11):3-7
Duan F Q, He K B,Liu X D,et al. Progress in research on carbon aerosols: organic carbon and element carbon [J]. Journal of environmental engineering, 2007, 1(8): 1-8
Wu D. The review and prospect of the study of aerosol in south China [J]. Journal of tropical weather,2003,19(5):145-151
Koch D. Transport and direct radiative forcing of carbonaceous and sulfate aerosols in the GISS GCM. J Geophys Res, 2001, 106(17):20311-20332
View ArticleZhen A Q,Su Y X,Zhao J D. Research status of black carbon aerosol [J]. Energy environment protection,2007,21(5):4-9
Yan H,Jiao M Y, Bi B G, et al. Development of aerosol observation network at home and abroad and related science programs. Meteorological science, 2006, 26(1): 110-117
Bai J H, Wang G C. New progress in the study of black carbon aerosols [J]. Science and technology engineering,2005,5(9):585-592
Bond T C, Streets D G, Yarber K F, et al. Atechnology-based global inventory of black and organic carbon emissions from com-bustion. J Geophys Res, 2004, 109: D14203
View ArticleGoss C H, Newsom S A, Schildcrout J S, et al. Effect of ambient air pollution on pulmonary exacerbations and lung function in cystic fibrosis. American Journal of Respiratory and Critical Care Medicine, 2004, 169(7): 816-821 PMid:14718248
View Article PubMed/NCBIHansen J, Sato M, Ruedy R, et al. Global warming in the twenty-first century: an alternative scenario. PNAS, 1998(97): 9875-9880 PMid:10944197
View Article PubMed/NCBIZhang H, Ma J H, Zheng Y F. Study on the global distribution of black carbon aerosol radiation [J]. Atmospheric sciences, 2008,32(5):1147-1158
Ramanathan V, Carmichael G. Global and regional climate changes due to black carbon. Nature, 2008(1): 221-227
View ArticleYang G F, Jiang H, Yu S Q, et al. Estimates of the release of black carbon from forest fires in Zhejiang province from 1991 to 2006 [J]. Acta ecologica sinica,2009, 29(5): 2612-2621
Simpson J M, Hatcher G P. Overestimates of black carbon in soils and sediment. Natur wissenschaften, 2004,91(9): 436-440 PMid:15278224
View Article PubMed/NCBIBond T C, Bhardwaj J E, Dong R, et al. Historical emissions of black and organic carbon aerosol from energy-related combustion, 1850-2000. Global Biogeochem Cycles, 2007, 21(2): B2018(1-16)
View ArticleSato M, Hansen J, Koch D, et al. Global atmospheric black carbon inferred from AERONET. Proc Natl Acad Sci USA, 2003, 100(11): 6319-6324 PMid:12746494
View Article PubMed/NCBIWang R. Black carbon's global emissions and atmospheric migration and exposure risk and radiation forced assessments [J].Beijing: Beijing University, 2013
Huang G, Liu W, Liu Z H, et al. Research overview of black carbon aerosol [J]. Science of disaster,2015,30(2):205-214
Xu L, Wang Y Q, Chen Z L, et al. Research progress of black carbon aerosol Ι: emissions, clear, and concentration [J]. Earth science progress,2006(4):352-356
Chenhe Zhang, Xinghong Chen, Tianliang Zhao, et al.The influence of different weather conditions on the change of high black carbon concentration in Beijing urban area[J].Journal of Environmental Science,2017, 37(6):2255-2264.
Shuhui Zhu, Min Zhou, Liping Qiao, et al.Influence of air flow track on the concentration and distribution of fine particles in the Yangtze River Delta region in December 2015[J].Earth science progress,2016, 36(12):4285-4294.
Xianli Liu, Dijun Wan, Jiaquan Zhang, et al.Research Progress on the analytical methods of black carbon sources in the environment[J].Journal of ecological environment, 2016, 25(9):1575-1583
Safai P D, Raju M P, Budhavant K B, et al. Long term studies on characteristics of black carbon aerosols over a tropical urban station Pune India[J]. Atmospheric Research, 2013, 132(133): 173-184
View ArticleHealy R M, Sciare J, Poulain L, et al. Sources and mixing state of size-resolved elemental carbon particles in a European megacity: Paris[J]. Atmospheric Chemistry and Physics, 2012, 12(4): 1681-1700
View ArticleAhmed T, Dutkiewicz V A, Khana, et al. Long term trends in black carbon concentrations in the Northeastern United States[J]. Atmospheric Research, 2014, 137: 49-57
View ArticleVenkatachari p, Zhou L, Hopke P K, et al. Spatial and temporal variability of black carbon in New York City[J]. Journal of Geophysical Research, 2006, 111(D10): doi: 10. 1029/2005JD006314
View ArticleDoumbia E H T, Liousse C, Galy-Lacaux C, et al. Real time black carbon measurements in West and Central Africa urban sites[J]. Atmospheric Environment, 2012, 54: 529-537
View ArticleTiwari S, Srivastava A K, Bisht D S, et al. Diurnal and seasonal variations of black carbon and PM2.5 over New Delhi, India: Influence of meteorology[J]. Atmospheric Research, 2013, 125-126: 50-62
View ArticleSharma R K, Bhattarai B K, Sapkota B K, et al. Black carbon aerosols variation in Kathmandu valley, Nepal[J]. Atmospheric Environment, 2012, 63: 282-288
View ArticleZhang W, Shao D M, Yin H B, et al. The trajectory analysis of the gas block in China's coastal cities [J]. Atmosphere,1994,20(12):46-49
Chen C, He X, Yang L. Characteristics of black carbon quality in environmental air in Hangzhou [J]. Environmental monitoring management and technology,2015, 27(1): 60-62
Zhuang B.L, Wang, T.J, Liu J, et al. Continuous measurement of black carbon aerosol in urban Nanjing of Yangtze River Delta, China. Atmospheric Environment, 2014 (89): 415-424
View ArticleZhang Xiaolin, Rao Ruizhong, Huang Yinbo, et al. Black carbon aerosols in urban central China. Journal of Quantitative Spectroscopy & Radiative Transfer, 2015 (150): 3-11
View ArticleVerma, R.L., Sahu, L.K., Kondo, Y., et al., 2010. Temporal variations ofblack carbon in Guangzhou, China, in summer 2006. Atmospheric Chemistryand Physics 10, 6471e6485
View ArticleYan Lu, Qingeng Wang, Yanyan Zhang.Study on the characteristics of black carbon emission in the Yangtze River Delta[J].Journal of Nanjing University (Natural Science),2015(3):535-542.
Ramachandran S, Rajesh TA. Black carbon aerosol mass concentra-tions over Ahmedabad, an urban location in western India: compar-ison with urban sites in Asia, Europe, Canada, and the United States.J Geophys Res 2007;112: D06211
View Article