Pamela K. Shiao, Ph.D., RN, FAAN
E-mail: pshiao@msn.com, Phone number: (818) 233-6112
© 2019 Sift Desk Journals. All Rights Reserved
VOLUME: 3 ISSUE: 4
Page No: 417-430
Pamela K. Shiao, Ph.D., RN, FAAN
E-mail: pshiao@msn.com, Phone number: (818) 233-6112
Robin Johns1, Joyce Kusuma2, Amanda Lie3, S. Pamela K. Shiao4
Article Under Review
Personalized nutrition and precision healthcare require valid, reliable and clinically-applicable instruments including dietary assessment. Accurate assessment of essential nutrients including methyl donors associated with nutrigenomics one carbon metabolism for DNA methylation is critical for associated health outcomes. We examined nutrients between the food frequency questionnaire (FFQ) and 24-hour food record (FR) by accessing USDA Nutrition Data System for Research (NDSR-FR) for social-ethnic diets with the differences <10% or >10% on the total calories. Overall, NDSR-FR presented lower estimates of most nutrients than FFQ. Correlation coefficients between the two measures were consistently high for all 25 essential nutrients (mean = 0.98) for cases with <10% of calories difference (n=81). Percent differences between NDSR-FR and FFQ were within 10% for all macronutrients; B vitamins including thiamin, riboflavin, niacin, pyridoxine, folate and cobalamin; and other methyl donors including choline, glycine, and methionine. NDSR-FR underestimated (>10%) vitamin E and overestimated vitamin C compared to FFQ. Bland-Altman analyses demonstrated the average for all nutrients was with >95% limits of agreement (mean: 95%, range: 83%-99%), suggesting an acceptable level of agreement between the two measures. Outlier analyses revealed sources of disagreement for cases with >10% differences for total calorie, protein, and fat. Bland-Altman plots showed wide scatter of differences both for plant-based (folate, vitamins C and E) and protein-based nutrients (pyridoxine, cobalamin, methionine, glycine, and choline) for outliers. These results support the overall capacity of NDSR-FR in comparison to FFQ on estimating essential nutrients and methyl donors in relation to DNA methylation for various social-ethnic populations.
Keywords: validation; methyl donors; 24-hour food record; food frequency questionnaire (FFQ); Nutrition Data System for Research (NDSR); social ethnic diet
Adequate nutrient intake through healthy eating is a modifiable factor in disease prevention and improved health outcomes for personalized nutrition and precision-based healthcare (Tabung et al. 2017; Shiao et al. 2018a, 2018b). Balanced intakes of essential nutrients including methyl donors associated with nutrigenomics one carbon metabolism (OCM) for DNA methylation is critical to health outcomes (Neeha and Kinth 2013; Gang et al. 2017; Newman & Maddocks 2017; Shiao et al. 2018a, 2018b, 2018c, 2018d). Dietary methyl donors including primarily B vitamins such as folate (B9) and cobalamin (B12), and some amino acids (e.g., methionine, glycine, and choline), provide essential enzymes needed to catalyze OCM (Anderson, Sant, & Dolinoy 2012). Consequently, dietary intake of these micronutrients may epigenetically influence disease prevention (Pauwels et al. 2015; Shiao et al. 2018a, 2018b, 2018c). Accurate assessment of nutrient intakes among various social-ethnic diets is vital to explore dietary associations with chronic disease and health outcomes among culturally diverse populations (Bouchard-Mercier et al. 2013; Palacios et al. 2015).
The food frequency questionnaire (FFQ), comprehensive form, is often used to examine the association between diet and disease risk (Pakseresht & Sharma 2010; Kowalkowska et al. 2013). It is designed to measure frequency and portion size of food and beverages consumed over time (i.e., 30 days) with demonstrated reproducibility and validity (Pauwels et al. 2015; Collins et al. 2015), including high agreement for macronutrient intake among various ethnic populations (Dehghan et al. 2013; Chiu et al. 2014a; Chen et al. 2015; Buscemi et al. 2015). However, it is burdensome to participants and researchers due to the length of the questionnaire, complex coding, and computation algorithms, all of which have the potential to affect compliance with data collection (Neuhouser, Kristal, McLerran, Patterson, & Atkinson 1999). On the other hand, the 24-hour food record (FR) has been widely used in clinical trials as an alternative to the FFQ because of its ease of administration with lower responder demand on time and burden, for applicability to the wide range of eating habits among diverse populations (Pakseresht & Sharma 2010; Prentice et al. 2011; Shim, Oh, & Kim 2014; Beaton, Wright, Devenish, Do, & Scott 2018). Following the dietary data collection, nutrient intakes for various nutrients can be quantified using USDA Nutrition Data System for Research software (NDSR, Nutrition Coordinating Center at University of Minnesota (UMNCC), to analyze 24-hour FR (NDSR-FR) (UMNCC 2016).
Various ethnic diets, influenced by cultural preferences and availability of food sources, may also impact methyl donor intake (Dehghan et al. 2013; Chen et al. 2015; Buscemi et al. 2015; Palacios et al. 2015). For example, omnivoire-based diets may result in lower intakes of carbohydrates, fiber, calcium, magnesium, folate, vitamin A, and higher intakes of saturated fat, cholesterol, and cobalamin when compared to vegetarian-based diets (Chiu et al. 2014b). In addition, many modern diets include high intakes of pre-packaged highly-refined convenience foods and fast-foods high in saturated fat, refined sugar, and sodium; and lower intakes of fiber, fresh fruits and vegetables (Powell & Nguyen 2013).
Individuals dependent on liquid diets or other restricted diets (e.g., elders, hospitalized patients, palliative care patients, and those with GI-related issues) frequently lack adequate essential nutrient intakes and often experience weight loss (Bazzan et al, 2013; Gellrich et al. 2015). Consequently, the lack of sufficient intake of dietary methyl donors places these vulnerable individuals at greater risk for negative health outcomes (Shiao et al. 2018a, 2018b, 2018c, 2018d).
In summary, evidence suggests the FFQ may provide a better estimate of nutrient intakes (Erkkilä et al. 2012; Zhuang et al. 2012; Kowalkowska et al. 2013; Fatihah et al. 2015), yet the 24-hour FR is frequently employed in clinical trials as an alternative for the FFQ because of its efficient utility. Thus, it is imperative to examine the agreement between the two measures, NDSR-FR and FFQ in assessing nutrient intakes. To date, however, no prior study has addressed whether the NDSR-FR can be a reliable alternative to the FFQ in estimating essential dietary nutrients including methyl donors for various social-ethnic diets and populations. Therefore, we examined the bias and agreement between the NDSR-FR and the FFQ in quantifying dietary nutrients in various social-ethnic diets representative of various culturally-diverse patient populations in the world.
A total of 131 social-ethnic diets representative of 12 different social and ethnic diets were generated based on various publicly available diet recipes. These diets included liquid diets for elders or patients unable to consume solid foods and ethnically-derived smoothie-based diets; poverty foods, American fast-foods, American high-school diets, American middle-income diets; as well as typical ethnic foods including Chinese, Japanese, Korean, Italian, Mexican and Mediterranean diets. A total of 25 essential nutrients including methyl donors were examined based on the list provided by current National Institute of Health (NIH) nutrient recommendations (https://ods.od.nih.gov/Health_ Information/Dietary_ Reference_Intakes.aspx). Macronutrients included total calories, carbohydrate, protein, total fat, saturated fat, cholesterol, and fiber. Micronutrients included vitamins (vitamin A, vitamin D, vitamin E, vitamin C, thiamin or B1, riboflavin or B2, niacin or B3, pyridoxine or B6, folate or B9, and cobalamin or B12) as commonly known methyl-donors, minerals (calcium, magnesium, iron, sodium, and zinc) as methylation co-factors, and other amino-acids as methyl-donors (methionine, glycine, and choline). These diets were entered into the databases using FFQ and NDSR-FR measures.
Dietary Measures
A 144-item FFQ was used to assess nutrient intakes over a 30-day period (Neuhouser, Kristal, McLerran, Patterson, & Atkinson 1999; Patterson et al. 1999). Divided into 3 sections, this comprehensive FFQ includes questions regarding 1) typical food choices (13 questions); 2) quantification of average food and beverage intakes including amount and frequency of cereals, breads, snack items, meat, fish, eggs, pasta, mixed dishes, soups, dairy products, vegetables, grains, fruits, condiments, sweets, beverages, and alcohol (128 questions, and 3) summary questions (3 questions) regarding usual consumption of fruits, vegetables, and fat used in cooking (Patterson et al. 1999). Additional questions were added to adjust for fat intakes based on a list of questions involving added fat intakes such as common intakes on various meats with fat components, percent fat milk intakes, and intakes of fats on the tables. FFQ data involved 30-day patterns of foods was analyzed using the University of Minnesota Nutrition Coordinating Center (NCC) nutrient database (UMNCC 2016). Additionally, these diets were assessed using the 24-hour FR format and analyzed using the same NDSR software for NDSR-FR (version 2015, Nutrition Coordinating Center, University of Minnesota). Data entry for both measures was checked independently by two research team members to ensure accuracy prior to analysis.
Data Analysis
All statistical analyses were carried out using JMP® Pro version 13.0.0 software (SAS Institute, Cary, NC) (Grayson, Gardner, & Stephens 2015). Descriptive analyses were performed to generate means and standard deviations (SD) for all 25 nutrients for both FFQ and NDSR-FR measures. Pearson correlation coefficients (r) were used to examine the strength of the association between the two dietary measures on the nutrients (Willett et al.1985). To gain a visual assessment of the agreement (i.e., bias), we compared mean differences between two measures on nutrients using Bland-Altman plots and limits of agreement (Bland & Altman 1986). Mean differences were plotted between two measures on nutrients. The limits of agreement (mean difference ± 2 SD) indicate whether the agreement is acceptable (Erkkilä, Järvinen, Karvonen, Keronen, & Tuppurainen 2012), with good agreement indicated if 95% agreement between measures fall within ± 2 SDs of the mean (Pakseresht & Sharma 2010; Kowalkowska et al. 2013).
Comparisons between NDSR-FR against FFQ on 25 nutrients for cases (n = 81) with acceptable differences (<10% on the total calories) are presented in Table 1. Pearson correlation coefficients for nutrients between the two measures were consistently high, ranging from 0.94 for cobalamin to 0.99 for calories, fat, saturated fat, carbohydrates, protein, cholesterol, fiber, thiamin, riboflavin, niacin, pyridoxine, magnesium, iron, methionine, and choline; with an overall mean of 0.98 for 25 nutrients (all p < 0.001). Overall, the majority of nutrients measured by NDSR-FR were lower than those by FFQ with the exception of carbohydrates, fiber vitamins A and C, pyridoxine, magnesium, and sodium which measured higher with NDSR-FR compared to FFQ. For all nutrients, the mean difference between the two measures was 5.3%, ranging from 0.4% for zinc to 31% for Vitamin E. Estimates of calories and macronutrients (carbohydrate, fat and protein), cholesterol, fiber; and micronutrients including vitamin A, vitamin D, minerals (calcium, sodium, magnesium, iron, zinc), and other amino-acid based methyl donors (methionine, glycine and choline) showed good agreement between the two measures with less than 10% difference. There was lesser agreement (>10% difference) for estimates of Vitamin C (13%) and E (31%). For specific dietary methyl donors, using a 10% criterion, the mean differences between two measures were acceptable for all B vitamins including thiamin (-5.3%), riboflavin (-3.9%), niacin (-2.1%), pyridoxine (6.1%), folate (-8.3%) and cobalamin (-6.5%); and other amino-acid based methyl donors including choline (-1.8%), glycine (-1.9%), and methionine (-3.3%). Thus, we found a high level of agreement on micronutrients vital in the nutrigenomics OCM pathway. Bland-Altman analyses demonstrated the mean differences for all nutrients were within 95% limits of agreement (mean = 95%, range: 83%-99%), suggesting an acceptable level of agreement between the two measures.
Table 1. Agreement (correlation, difference) and bias (standard error) between two dietary measures: ≤10% on total calories (n = 81).
|
Parameters |
FFQ M ± SD |
NDSR-FR M ± SD |
r* |
Difference M ± SD |
SE |
% Difference |
||
|
M ± SD |
± 1 SD (%) |
± 2 SD (%) |
||||||
|
Calories (kcal) |
1461 ± 1107 |
1441 ± 1082 |
0.99 |
-20 ± 117 |
13 |
-0.7 ± 4.1 |
-4.7 – 3.4 (68) |
-8.8 – 7.5 (98) |
|
Fat (g) |
52 ± 40 |
50 ± 38 |
0.99 |
-2.1 ± 6.8 |
0.7 |
-4.0 ± 11 |
-15 – 6.7 (64) |
-25 – 17 (96) |
|
Sat Fat (g) |
16 ± 13 |
15 ± 12 |
0.99 |
-0.6 ± 2.2 |
0.2 |
-1.0 ± 6.8 |
-7.8 – 5.8 (70) |
-15 – 13 (98) |
|
Carbohydrate g) |
190 ± 159 |
196 ± 165 |
0.99 |
5.3 ± 25 |
2.7 |
1.8 ± 7.8 |
-6.0 – 9.5 (73) |
-14 – 17 (93) |
|
Protein (g) |
63 ± 44 |
59 ± 40 |
0.99 |
-4.1 ± 7.2 |
0.8 |
-4.3 ± 6.2 |
-10 – 1.9 (63) |
-17 – 8.0 (86) |
|
Cholesterol (mg) |
221 ± 153 |
207 ± 136 |
0.99 |
-14 ± 28 |
3.1 |
-2.8 ± 8.4 |
-11 – 5.6 (62) |
-20 – 14 (89) |
|
Fiber (g) |
18 ± 19 |
20 ± 21 |
0.99 |
1.1 ± 3.3 |
0.4 |
2.5 ± 11 |
-8.0 – 13 (73) |
-18 – 23 (94) |
|
Vitamin A (IU) |
13527 ± 16021 |
15307 ± 19835 |
0.97 |
1780 ± 5277 |
574 |
5.2 ± 26 |
-21 – 31 (69) |
-46 – 57 (96) |
|
Vitamin D (mcg) |
4.7 ± 2.6 |
4.2 ± 2.2 |
0.98 |
-0.5 ± 0.6 |
0.1 |
-6.9 ± 6.0 |
-13 – -0.9 (72) |
-19 – 5.1 (94) |
|
Vitamin E (mcg) |
11 ± 8.7 |
6.9 ± 5.9 |
0.97 |
-4.3 ± 3.2 |
0.4 |
-31 ± 13 |
-44 – -18 (80) |
-57 – -4.8 (94) |
|
Vitamin C (mcg) |
140 ± 150 |
159 ± 164 |
0.98 |
20 ± 31 |
3.4 |
13 ± 23 |
-9.8 – 37 (90) |
-33 – 60 (96) |
|
Thiamin (mg) |
1.2 ± 0.8 |
1.1 ± 0.9 |
0.99 |
-0.1 ± 0.1 |
0.01 |
-5.3 ± 8.0 |
-13 – 2.7 (67) |
-21 – 11 (95) |
|
Riboflavin (mg) |
1.4 ± 1.0 |
1.3 ± 1.0 |
0.99 |
-0.04 ± 0.1 |
0.01 |
-3.9 ± 6.2 |
-10 – 2.4 (62) |
-16 – 8.6 (100) |
|
Niacin (mg) |
16 ± 12 |
16 ± 11 |
0.99 |
-0.5 ± 2.0 |
0.2 |
-2.1 ± 7.7 |
-9.7 – 5.6 (70) |
-17 – 13 (95) |
|
Pyridoxine (mg) |
1.7 ± 1.5 |
1.8 ± 1.6 |
0.99 |
0.2 ± 0.3 |
5.1 |
6.1 ± 7.8 |
-1.7 – 14 (70) |
-9.5 – 22 (96) |
|
Folate (mcg) |
334 ± 245 |
309 ± 255 |
0.98 |
-25 ± 46 |
0.02 |
-8.3 ± 12 |
-20 – 3.8 (52) |
-33 – 16 (83) |
|
Cobalamin (mcg) |
4.1 ± 2.4 |
3.7 ± 2.3 |
0.94 |
-0.4 ± 0.9 |
0.1 |
-6.5 ± 11 |
-17 – 4.2 (69) |
-28 – 15 (95) |
|
Calcium (mg) |
679 ± 463 |
610 ± 409 |
0.98 |
-69 ± 100 |
11 |
-6.8 ± 6.6 |
-13 – -0.2 (80) |
-20 – 6.4 (88) |
|
Magnesium (mg) |
230 ± 178 |
235 ± 190 |
0.99 |
5.3 ± 32 |
3.4 |
0.8 ± 7.9 |
-7.1 – 8.7 (70) |
-15 – 17 (95) |
|
Iron (mg) |
10 ± 7 |
9.7 ± 7.2 |
0.99 |
-0.3 ± 1.2 |
0.1 |
-4.4 ± 9.7 |
-14 – 5.3 (68) |
-24 – 15 (99) |
|
Sodium (mg) |
2921 ± 2031 |
3223 ± 2226 |
0.98 |
313 ± 438 |
47 |
7.0 ± 6.9 |
0.1 – 14 (63) |
-6.8 – 21 (98) |
|
Zinc (mg) |
8.2 ± 5.6 |
8.2 ± 5.5 |
0.98 |
0.01 ± 1.0 |
0.1 |
0.4 ± 9.9 |
-9.6 – 10 (77) |
-19 – 20 (94) |
|
Methionine (g) |
1.4 ± 1.0 |
1.3 ± 0.9 |
0.99 |
-0.1 ± 0.2 |
0.02 |
-3.3 ± 7.1 |
-10 – 3.8 (78) |
-18 – 11 (88) |
|
Glycine (g) |
2.6 ± 1.8 |
2.5 ± 1.6 |
0.98 |
-0.12 ± 0.42 |
0.04 |
-1.9 ± 9.1 |
-11 – 7.2 (79) |
-20 – 16 (93) |
|
Choline (mg) |
302 ± 214 |
296 ± 213 |
0.99 |
-52 ± 23.8 |
2.6 |
-1.8 ± 4.6 |
-6.3 – 2.8 (63) |
-11 – 7.3 (98) |
Note: *p <.001; FFQ: food frequency questionnaire; NDSR-FR: Nutrition Data System for Research 24-hour food record
Outliers with Greater Differences between the Two Measures
To identify the potential sources of disagreements, diets that had acceptable differences versus those that had greater differences (>10% on the total calories) (Supplementary Table 1) between two measures of FFQ and NDSR-FR were analyzed separately. The outlier cases with >10% total calorie difference (Table 2) and >20% difference for fat (Table 3) were examined separately to gain further insights. For the cases (n = 17) with >10% difference on total calories between the two measures , correlation coefficients on many nutrients fell to <0.9 including calories, fat, carbohydrates, vitamin E, thiamine, riboflavin, folate, calcium, iron, sodium, and choline. Mean difference was 8.6% for all nutrients, and ranged from -0.9% for methionine to -25% for vitamin E, with higher differences for generally plant-based nutrients (e.g., carbohydrates, fiber, pyridoxine, vitamin E, and vitamin C than protein-based nutrients (e.g., protein, cholesterol, vitamin D, thiamin, niacin, cobalamin, methionine, and glycine) (Table 2).
The results from the analysis of 46 cases identified with >20% difference between the two dietary measures for fat are presented in Table 3. Correlation coefficients between FFQ and NDSR-FR for these cases also fell to less than 0.9 for many nutrients, with the lowest correlations noted for fat, vitamin E, and choline. The average mean differences was 6.7% for all 25 nutrients. Lower agreement was noted for fat, saturated fat, and the fat-soluble vitamins A, and E; as well as vitamin C. All 25 nutrients demonstrated good agreement with 95% differences between the two measures falling within ± 2 SDs (Table 3).
Table 2. Agreement (Correlation, Difference) and Bias (Standard Error) between Two Dietary Measurements: Greater Differences ≥ 10% Total Calories (n = 17).
|
Parameters |
FFQ M ± SD |
NDSR-FR M ± SD |
r* |
Difference M ± SD |
SE |
% Difference |
||
|
M ± SD |
± 1 SD (%) |
± 2 SD (%) |
||||||
|
Calories (kcal) |
1150 ± 469 |
1149 ± 423 |
0.74 |
-0.8 ± 345 |
77 |
4.3 ± 26 |
-22 – 31 (88) |
-48 – 57 (88) |
|
Fat (g) |
47 ± 29 |
36 ± 22 |
0.89 |
-11 ± 14 |
3.3 |
-18 ± 28 |
-45 – 10 (71) |
-73 – 38 (100) |
|
Sat Fat (g) |
14 ± 8.7 |
10 ± 5.7 |
0.94 |
-3.5 ± 3.9 |
0.9 |
-11 ±17 |
-29 – 5.9 (59) |
-46 – 23 (100) |
|
Carbohydrate (g) |
149 ± 67 |
180 ± 105 |
0.80 |
30 ± 66 |
14 |
12 ± 27 |
-16 – 39 (82) |
-43 – 66 (88) |
|
Protein (g) |
41 ± 13 |
38 ± 12 |
0.93 |
-2.9 ± 5.5 |
1.3 |
-4.4 ± 7.6 |
-12 – 3.2 (65) |
-20 – 11 (100) |
|
Cholesterol (mg) |
138 ± 87 |
116 ± 71 |
0.99 |
-22 ± 20 |
4.9 |
-9.5 ± 6.6 |
-16 – 2.9 (65) |
-23 – 3.7 (94) |
|
Fiber (g) |
15 ± 13 |
20 ± 21 |
0.91 |
5.4 ± 11 |
2.3 |
14 ± 31 |
-17 – 45 (82) |
-48 – 76 (94) |
|
Vitamin A (IU) |
9226 ± 13294 |
12553 ± 17731 |
0.94 |
3326 ± 7093 |
1547 |
6.4 ± 34 |
-28 – 40 (59) |
-62 – 74 (100) |
|
Vitamin D (mcg) |
2.9 ± 1.0 |
2.5 ± 0.8 |
0.90 |
-0.4 ± 0.5 |
0.1 |
-7.7 ± 8.4 |
-16 – 0.7 (88) |
-24 – 9.0 (94) |
|
Vitamin E (mcg) |
9.6 ± 5.3 |
6.3 ± 4.3 |
0.83 |
-3.3 ± 2.9 |
0.7 |
-25 ± 24 |
-49 – -0.6 (77) |
-74 – 24 (100) |
|
Vitamin C (mcg) |
125 ± 148 |
175 ± 203 |
0.98 |
51 ± 67 |
15 |
23 ± 30 |
-6.3 – 53 (71) |
-36 – 83 (94) |
|
Thiamin (mg) |
0.9 ± 0.3 |
0.9 ± 0.3 |
0.83 |
0.01 ± 0.2 |
0.04 |
2.5 ± 20 |
-17 – 22 (82) |
-37 – 42 (88) |
|
Riboflavin (mg) |
1.0 ± 0.3 |
1.0 ± 0.3 |
0.62 |
0.06 ± 0.3 |
0.1 |
4.6 ± 21 |
-17 – 26 (82) |
-38 – 47 (88) |
|
Niacin (mg) |
11 ± 4.6 |
11.2 ± 4.5 |
0.92 |
0.03 ± 1.9 |
0.4 |
4.5 ± 20 |
-15 – 25 (82) |
-35 – 45 (94) |
|
Pyridoxine (mg) |
1.2 ± 0.8 |
1.6 ± 1.1 |
0.90 |
0.4 ± 0.6 |
0.1 |
18 ± 23 |
-5.3 – 41 (82) |
-28 – 64 (88) |
|
Folate (mcg) |
249 ± 124 |
253 ± 159 |
0.82 |
3.8 ± 92 |
20 |
1.6 ±28 |
-27 – 30 (71) |
-55 – 58 (94) |
|
Cobalamin (mcg) |
2.2 ± 1.0 |
2.1 ± 0.9 |
0.95 |
-0.2 ± 0.3 |
0.1 |
-4.0 ± 9.9 |
-14 – 6.0 (71) |
-24 – 16 (94) |
|
Calcium (mg) |
454 ± 138 |
460 ± 102 |
0.83 |
6.1 ± 87 |
19 |
2.5 ± 13 |
-10 – 15 (77) |
-23 – 28 (88) |
|
Magnesium (mg) |
168 ± 92 |
193 ± 121 |
0.92 |
25 ± 52 |
11 |
8.4 ± 19 |
-11 – 28 (71) |
-30 – 47 (88) |
|
Iron (mg) |
7.1 ± 2.8 |
7.5 ± 2.9 |
0.81 |
0.5 ± 1.9 |
0.4 |
10 ± 30 |
-19 – 40 (77) |
-49 – 70 (94) |
|
Sodium (mg) |
2014 ± 838 |
2180 ± 813 |
0.77 |
166 ± 602 |
132 |
8.1 ± 27 |
-19 – 35 (88) |
-46 – 62 (88) |
|
Zinc (mg) |
5.4 ± 1.9 |
5.8 ± 1.7 |
0.94 |
0.4 ± 0.7 |
0.2 |
6.9 ± 12 |
-5.1 – 19 (82) |
-17 – 13 (88) |
|
Methionine (g) |
0.8 ± 0.4 |
0.8 ± 0.3 |
0.95 |
-0.1 ± 0.1 |
0.03 |
-0.9 ± 14 |
-15 – 13 (82) |
-29 – 27 (88) |
|
Glycine (g) |
1.6 ± 0.7 |
1.5 ±0.6 |
0.91 |
-0.1 ± 0.3 |
0.1 |
2.3 ± 19 |
-17 – 21 (88) |
-35 – 40 (88) |
|
Choline (mg) |
198 ± 75 |
210 ± 79 |
0.78 |
12 ± 55 |
12 |
5.9 ± 22 |
-16 – 27 (88) |
-37 – 49 (88) |
Note: *p <.001; FFQ: food frequency questionnaire; NDSR-FR: Nutrition Data System for Research 24-hour food record
Table 3. Agreement (Correlation, Difference) and Bias (Standard Error) between Two Dietary Measurements: Greater Differences ≥ 20% Calories from Fat (n = 46).
|
Parameters |
FFQ M ± SD |
NDSR-FR M ± SD |
r* |
Difference M ± SD |
SE |
% Difference |
||
|
M ± SD |
± 1 SD (%) |
± 2 SD (%) |
||||||
|
Calories (kcal) |
1206 ± 341 |
1159 ± 316 |
0.84 |
-47 ± 198 |
28 |
-1.6 ± 16 |
-17 – 14 (96) |
-33 – 29 (96) |
|
Fat (g) |
54 ± 21 |
47 ± 24 |
0.78 |
-7.2 ± 15 |
2.2 |
-17 ± 26 |
-43 – 9.1 (71.7) |
-68 – 35 (100) |
|
Sat Fat (g) |
16 ± 5.9 |
13 ± 4.9 |
0.85 |
-2.8 ± 2.3 |
0.5 |
-11 ± 13 |
-25 – 2.1 (80) |
-38 – 15 (100) |
|
Carbohydrate (g) |
139 ± 58 |
149 ± 63 |
0.85 |
9.3 ± 34 |
4.8 |
4.5 ± 16 |
-11 – 20 (96) |
-27 – 36 (96) |
|
Protein (g) |
45 ± 12 |
42 ± 12 |
0.95 |
-2.9 ± 3.9 |
0.6 |
-4.6 ± 5.7 |
-10 – 1.1 (89) |
-16 – 6.7 (100) |
|
Cholesterol (mg) |
180 ± 68 |
156 ± 60 |
0.97 |
-25 ± 18 |
2.7 |
-9.4 ± 6.3 |
-16 – -3.1 (83) |
-22 – 3.2 (96) |
|
Fiber (g) |
12 ± 9.3 |
14 ± 12 |
0.88 |
2.0 ± 6.0 |
0.9 |
7.2 ± 18 |
-11 – 25 (96) |
-29 – 43 (100) |
|
Vitamin A (IU) |
6170 ± 7915 |
8666 ± 11261 |
0.94 |
2495 ± 4748 |
672 |
15 ± 25 |
-9.5 – 40 (76) |
-34 – 65 (100) |
|
Vitamin D (mcg) |
3.8 ± 1.9 |
3.4 ± 1.8 |
0.98 |
-0.4 ± 0.4 |
0.1 |
-7.6 ± 5.7 |
-13 – 1.9 (94) |
-19 – 3.8 (98) |
|
Vitamin E (mcg) |
9.7 ± 3.3 |
6.0 ± 3.5 |
0.70 |
-3.7 ± 2.6 |
0.4 |
-32 ± 22 |
-54 – -10 (67) |
-76 – 12 (100) |
|
Vitamin C (mcg) |
88 ± 84 |
114 ± 107 |
0.95 |
25 ± 39 |
5.5 |
15 ± 20 |
-5.3 – 36 (70) |
-26 – 56 (100) |
|
Thiamin (mg) |
0.9 ± 0.3 |
0.8 ± 0.2 |
0.90 |
0.03 ± 0.1 |
0.01 |
-2.0 ± 12 |
-14 – 10 (94) |
-26 – 22 (96) |
|
Riboflavin (mg) |
1.0 ± 0.2 |
1.0 ± 0.2 |
0.80 |
-0.01 ± 0.2 |
0.02 |
-0.1 ± 12 |
-13 – 12 (94) |
-25 – 25 (96) |
|
Niacin (mg) |
12.3 ± 3.4 |
12 ± 3.1 |
0.93 |
-0.3 ± 1.3 |
0.2 |
-0.6 ± 0.9 |
-11 – 9.3 (94) |
-20 – 19 (100) |
|
Pyridoxine (mg) |
1.2 ± 0.6 |
1.4 ± 0.8 |
0.86 |
0.2 ± 0.3 |
0.04 |
10 ± 13 |
-3.3 – 23 (94) |
-17 – 37 (98) |
|
Folate (mcg) |
226 ± 96 |
225 ± 109 |
0.90 |
-1.5 ± 57 |
8.1 |
-1.1 ± 16 |
-17 – 15 (91) |
-33 – 31 (100) |
|
Cobalamin (mcg) |
3.1 ± 1.1 |
2.9 ± 1.1 |
0.90 |
-0.1 ± 0.5 |
0.1 |
-2.6 ± 8.2 |
-11 – 5.6 (83) |
-19 – 14 (98) |
|
Calcium (mg) |
459 ± 142 |
442 ± 94 |
0.84 |
-16 ± 82 |
12 |
-0.4 ± 11 |
-12 – 11 (76) |
-23 – 23 (96) |
|
Magnesium (mg) |
152 ± 62 |
164 ± 70 |
0.90 |
12 ± 31 |
4.4 |
4.6 ± 12 |
-7.7 – 17 (91) |
-20 – 29 (96) |
|
Iron (mg) |
7.5 ± 2.0 |
7.7 ± 2.0 |
0.84 |
0.2 ±1.2 |
0.2 |
2.8 ± 16 |
-13 – 18 (94) |
-28 – 34 (100) |
|
Sodium (mg) |
2120 ± 572 |
2299 ± 669 |
0.79 |
178 ± 441 |
62 |
6.0 ± 17 |
-11 – 23 (96) |
-29 – 41 (96) |
|
Zinc (mg) |
6.2 ± 1.4 |
6.7 ± 1.5 |
0.89 |
0.5 ± 0.8 |
0.1 |
6.1 ± 9.3 |
-3.2 – 15 (87) |
-13 – 25 (96) |
|
Methionine (g) |
1.0 ± 0.3 |
1.0 ± 0.3 |
0.95 |
-0.1 ± 0.1 |
0.01 |
-3.4 ± 9.4 |
-13 – 6.1 (91) |
-22 – 16 (96) |
|
Glycine (g) |
1.9 ± 0.6 |
1.9 ± 0.6 |
0.92 |
-0.1 ± 0.2 |
0.03 |
-1.5 ± 13 |
-14 – 11 (94) |
-27 – 24 (96) |
|
Choline (mg) |
222 ± 62 |
209 ± 49 |
0.37 |
-13 ± 69 |
9.8 |
-2.3 ±18 |
-20 – 16 (94) |
-39 – 34 (94) |
Note: *p <.001; FFQ: food frequency questionnaire; NDSR-FR: Nutrition Data System for Research 24-hour food record
Bland-Altman Plots
Bland-Altman plots were incorporated to graphically demonstrate the mean differences on nutrients between the two measures. Figures 1-3 present side-by-side comparison of Bland-Altman and correlation plots for key methyl donors including folate (Figures 1a-b: ≤10% calorie difference, c-d: >10% calorie difference, e-f: > 20% fat difference), cobalamin (Figures 2a-f), and choline (Figures 3a-f). Bland-Altman and correlation plots were also used illustrate mean differences against the average of two measures on major nutrients of fat (Supplementary Figures S1a-f) and calories from carbohydrates (Supplementary Figures S2a), and other key nutrients of significant differences vitamins E and C (Supplementary Figures S3a-f and S4a-f); pyridoxine (Supplementary Figures S5a-f), and other methyl donors methionine and glycine (Supplementary Figures S6a-f and S7a-f). Bland-Altman plots displayed a wide scatter of differences both for plant-based (e.g., folate, vitamins C and E) and protein-based nutrients (e.g., pyridoxine, cobalamin, methionine, glycine, and choline), demonstrating agreement between the two measures worsened as average intakes increased. With the exception of vitamin C, Bland-Altman plots for each of these nutrients revealed consistency with the underestimation of nutrient intakes by NDSR-FR compared to the FFQ.
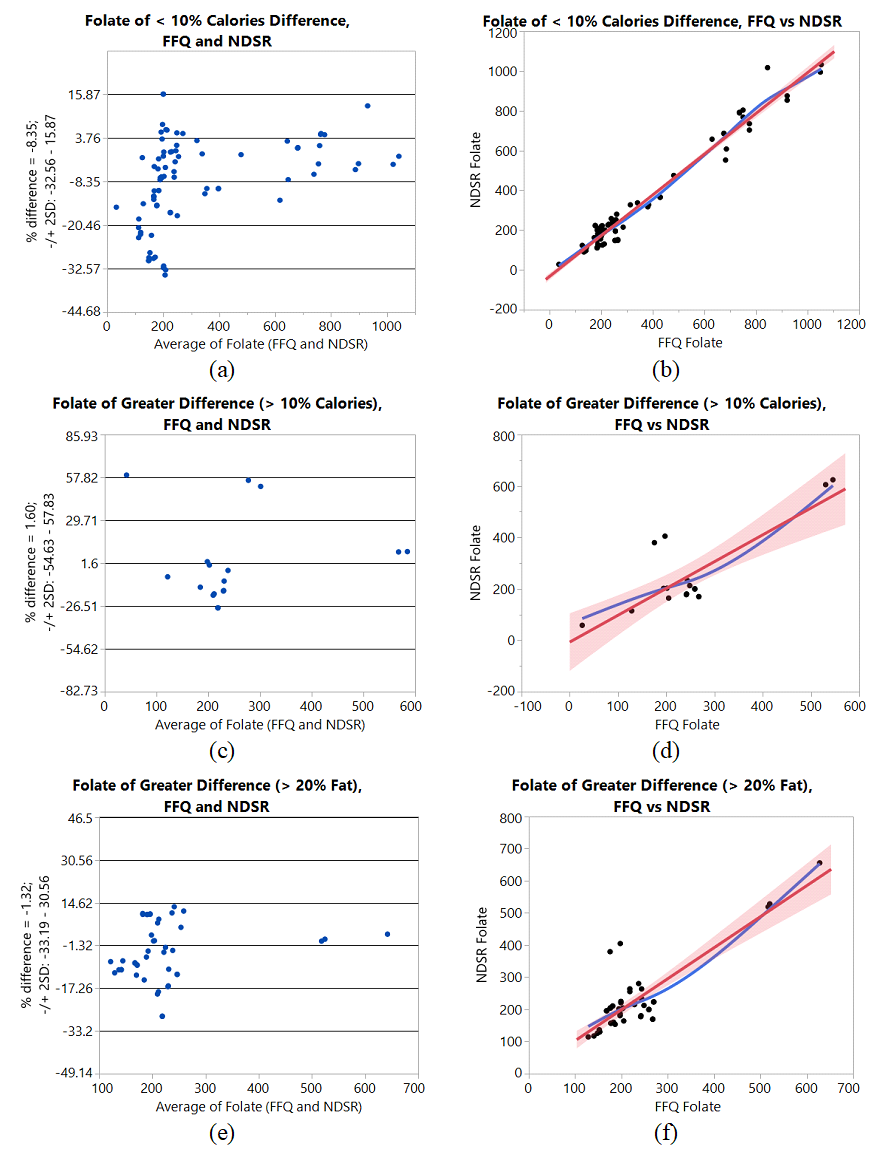
Figure 1a-f. Bland-Altman and correlation plots for bias and agreement between two dietary measures for folate; (a-b): ≤ 10% calorie difference, (c-d): ≥ 10% calorie difference, (e-f): ≥ 20% fat difference.
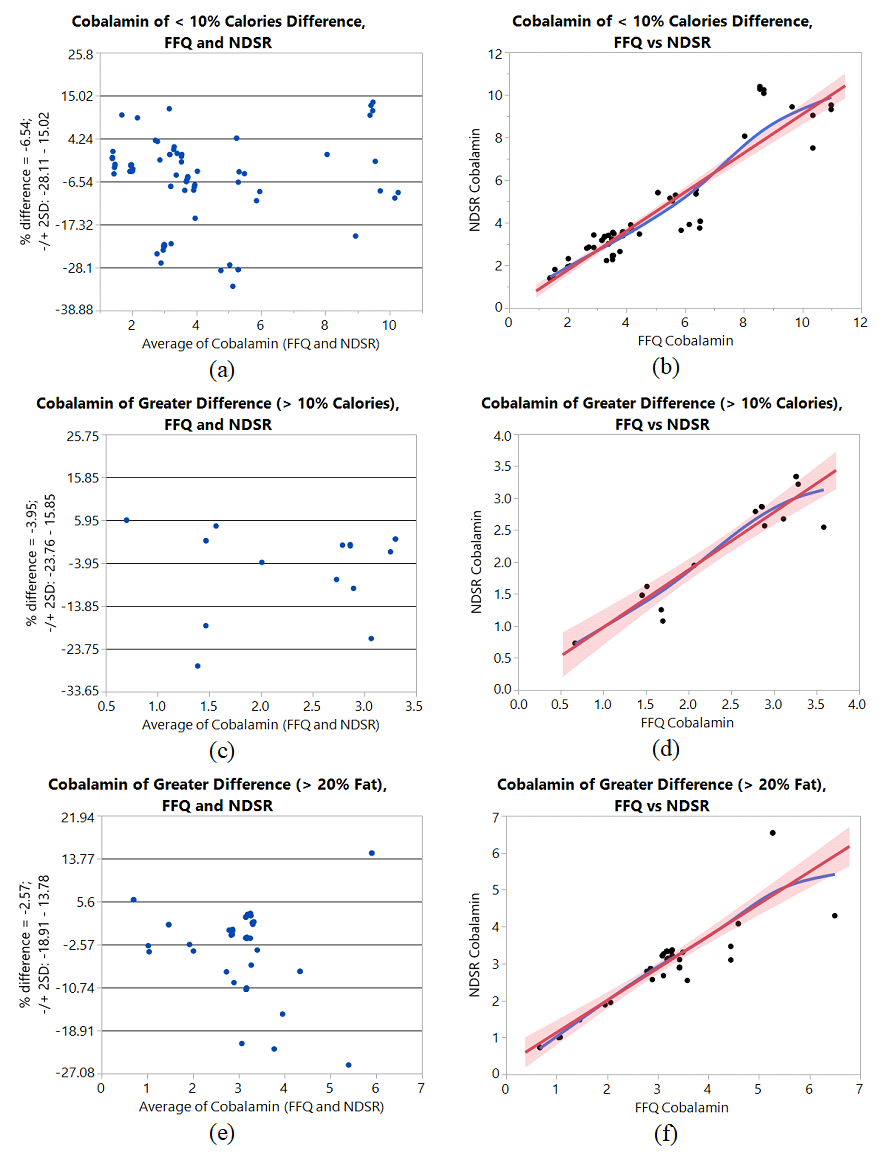
Figure 2a-f. Bland-Altman and correlation plots for bias and agreement between two dietary measures for cobalamin; (a-b): ≤ 10% calorie difference, (c-d): ≥ 10% calorie difference, (e-f): ≥ 20% fat difference.
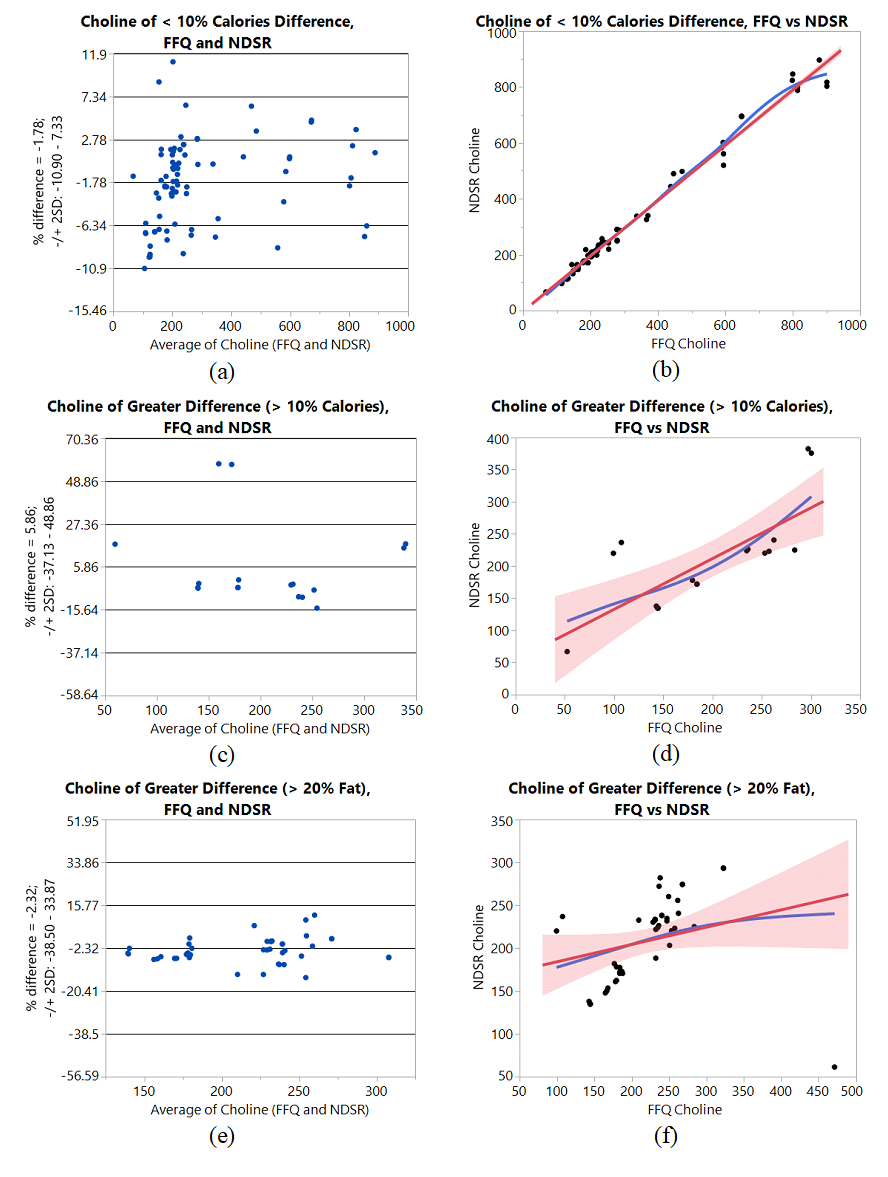
Figure 3a-f. Bland-Altman and correlation plots for bias and agreement between two dietary measures for choline; a-b: ≤ 10% calorie difference, c-d: ≥ 10% calorie difference, e-f: ≥ 20% fat difference.
Dietary methyl donors associated with nutrigenomics one carbon metabolism are essential in nutrition-based interventions aimed at the prevention and control of chronic health conditions. Various social-ethnic diets, influenced by age, disease processes, cultural preferences, availability of food sources, and financial resources may decrease dietary intakes of methyl donors. The development and evaluation of interventions designed to improve the dietary intakes of methyl donors for personalized nutrition and precision healthcare require valid, reliable and clinically-applicable instruments to assess food intakes among socially and ethnically-diverse populations. We validated the overall capacity of the NDSR-FR in comparison to FFQ on estimating essential nutrients and methyl donors in relation to DNA methylation for various social ethnic diets. We found acceptable agreement for differences between NDSR-FR against FFQ for all 25 essential nutrients, with agreement between the two measures lowest for vitamins E and C, and methyl donor pyridoxine. Correlation coefficients between NDSR-FR and FFQ were consistently high across all 25 nutrients. Compared to intake estimated from the FFQ, NDSR-FR underestimated the majority of nutrients; however, the estimates of daily nutrient intake by the two measures was generally comparable for all cases with Bland–Altman plots demonstrating good agreement between the two measures. Future studies focused on refining the accuracy of dietary instruments (e.g., FFQ, NDSR-FR) in quantifying nutrient intakes are needed to better understand the association of dietary intakes for methyl donors and other essential nutrients with health outcomes.
Supplementary Table S1. Agreement (correlation, difference) and bias (standard error) between two dietary measures for cases with greater differences (n = 50, >10% difference from total calories = 17, >20% difference from fat = 46, >20% difference from protein = 1).
|
Parameters |
FFQ M ± SD |
NDSR-FR M ± SD |
r* |
Difference M ± SD |
SE |
% Difference |
||
|
M ± SD |
± 1 SD (%) |
± 2 SD (%) |
||||||
|
Calories (kcal) |
1178 ± 380 |
1157 ± 384 |
0.85 |
-21 ± 221 |
30 |
-0.02 ± 16 |
-16 – 16 (90) |
-32 – 32 (96) |
|
Fat (g) |
51 ± 23 |
44 ± 25 |
0.81 |
-6.6 ± 15 |
2.0 |
-15 ± 25 |
-41 – 10 (74) |
-66 – 36 (98) |
|
Sat Fat (g) |
15 ± 6.5 |
12 ± 5.2 |
0.87 |
-2.5 ± 3.2 |
0.5 |
-10 ± 14 |
-24 – 3.7 (64) |
-37 – 17 (100) |
|
Carbohydrate (g) |
141 ± 66 |
156 ± 84 |
0.88 |
14 ± 41 |
5.6 |
6.2 ± 17 |
-11 – 23 (88) |
-28 – 40 (92) |
|
Protein (g) |
44 ± 12 |
41 ± 13 |
0.95 |
-2.5 ± 4.3 |
0.6 |
-4.5 ± 7.3 |
-12 – 2.8 (80) |
-19 – 10 (96) |
|
Cholesterol (mg) |
170 ± 75 |
147 ± 65 |
0.98 |
-23 ± 19 |
2.7 |
-8.6 ± 6.8 |
-15 – -1.8 (78) |
-22 – 5.0 (96) |
|
Fiber (g) |
13 ± 12 |
15 ± 16 |
0.93 |
2.7 ± 6.7 |
0.9 |
9.3 ± 20 |
-11 – 30 (92) |
-31 – 50 (94) |
|
Vitamin A (IU) |
7461 ± 10592 |
10031 ±13708 |
0.96 |
2569 ± 4694 |
639 |
14 ± 25 |
-11 – 39 (76) |
-35 – 64 (90) |
|
Vitamin D (mcg) |
3.7 ± 1.9 |
3.3 ± 1.7 |
0.98 |
-0.4 ± 0.3 |
0.1 |
-7.2 ± 6.0 |
-13 – -1.2 (86) |
-19 – 4.9 (94) |
|
Vitamin E (mcg) |
9.8 ± 4.3 |
6.2 ± 4.1 |
0.80 |
-3.6 ± 2.6 |
0.4 |
-31 ± 22 |
-53 – -8.7 (70) |
-76 – 14 (96) |
|
Vitamin C (mcg) |
102 ± 116 |
133 ± 150 |
0.97 |
32 ± 46 |
6.2 |
20 ± 30 |
-10 – 50 (76) |
-40 – 79 (96) |
|
Thiamin (mg) |
0.9 ± 0.3 |
0.8 ± 0.3 |
0.91 |
-0.02 ± 0.1 |
0.01 |
-1.1 ± 12 |
-13 – 11 (84) |
-26 – 23 (94) |
|
Riboflavin (mg) |
1.0 ± 0.2 |
1.0 ± 0.3 |
0.78 |
0.01 ± 0.2 |
0.02 |
1.2 ± 13 |
-12 – 14 (82) |
-24 – 27 (96) |
|
Niacin (mg) |
12 ± 4.1 |
12 ± 4.0 |
0.95 |
-0.1 ± 1.4 |
0.2 |
0.5 ± 13 |
-13 – 14 (86) |
-26 – 27 (94) |
|
Pyridoxine (mg) |
1.3 ± 0.7 |
1.5 ± 0.9 |
0.93 |
0.2 ± 0.4 |
0.1 |
11 ± 16 |
-4.5 – 27 (88) |
-20 – 43 (94) |
|
Folate (mcg) |
231 ± 118 |
233 ± 136 |
0.91 |
2.0 ± 57 |
7.8 |
0.02 ± 18 |
-18 – 18 (86) |
-35 – 36 (94) |
|
Cobalamin (mcg) |
3.0 ± 1.1 |
2.8 ± 1.1 |
0.90 |
-0.1 ± 0.5 |
0.1 |
-3.0 ± 9.1 |
-12 - 6.2 (82) |
-21 – 15 (92) |
|
Calcium (mg) |
460 ± 139 |
448 ± 98 |
0.83 |
-11 ± 81 |
11 |
0.2 ± 11 |
-11 – 11 (76) |
-22 – 23 (96) |
|
Magnesium (mg) |
158 ± 80 |
174 ± 96 |
0.94 |
15 ± 34 |
4.6 |
5.4 ± 13 |
-7.8 – 19 (86) |
-21 – 32 (94) |
|
Iron (mg) |
7.3 ± 2.4 |
7.6 ± 2.6 |
0.89 |
0.3 ± 1.3 |
0.2 |
4.2 ± 19 |
-15 – 23 (90) |
-33 – 42 (94) |
|
Sodium (mg) |
2069 ± 654 |
2274 ± 769 |
0.83 |
204 ± 444 |
61 |
6.9 ± 17 |
-10 – 24 (88) |
-27 – 41 (96) |
|
Zinc (mg) |
6.0 ± 1.6 |
6.5 ± 1.7 |
0.92 |
0.5 ± 0.8 |
0.1 |
6.0 ± 9.0 |
-3.0 – 15 (84) |
-12 – 24 (92) |
|
Methionine (g) |
1.0 ± 0.3 |
0.9 ± 0.3 |
0.96 |
-0.1 ± 0.1 |
0.01 |
-2.6 ± 9.4 |
-12 – 6.8 (86) |
-21 – 16 (96) |
|
Glycine (g) |
1.9 ± 0.6 |
1.8 ± 0.7 |
0.93 |
-0.04 ± 0.2 |
0.03 |
-0.5 ± 13 |
-13 – 12 (86) |
-26 – 25 (96) |
|
Choline (mg) |
218 ± 70 |
210 ± 65 |
0.53 |
-8.5 ± 68 |
9.4 |
-1.2 ± 18 |
-19 – 17 (88) |
-37 – 35 (92) |
Note: *p <.001; FFQ: food frequency questionnaire; NDSR-FR: Nutrition Data System for Research 24-hour food record
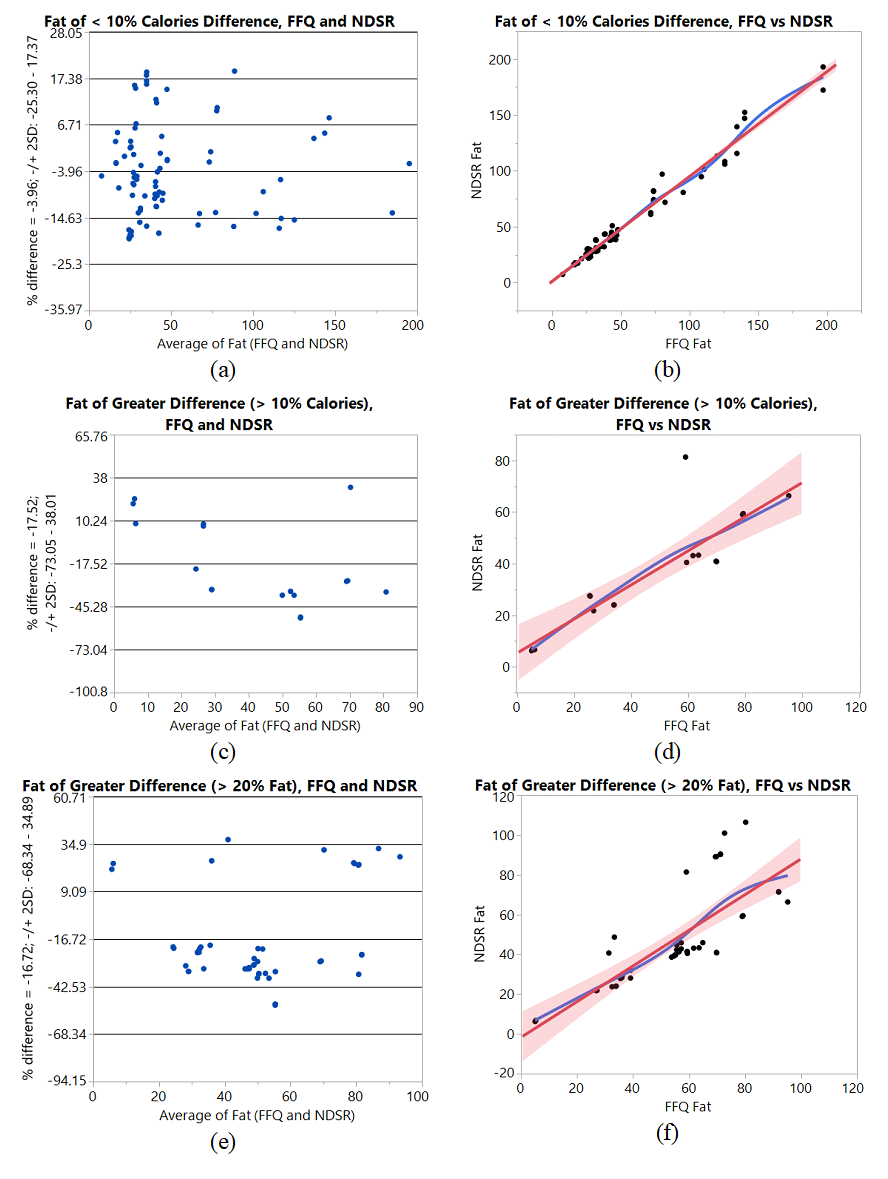
Figure S1a-f. Bland-Altman plots between two dietary measures on fat; a-b: ≤10% calorie difference, c-d: >10% calorie difference, e-f: >20% fat difference.

Figure S2a-f. Bland-Altman plots between two dietary measures on carbohydrate; (a-b): ≤10% calorie difference, (c-d): >10% calorie difference, (e-f): >20% fat difference.
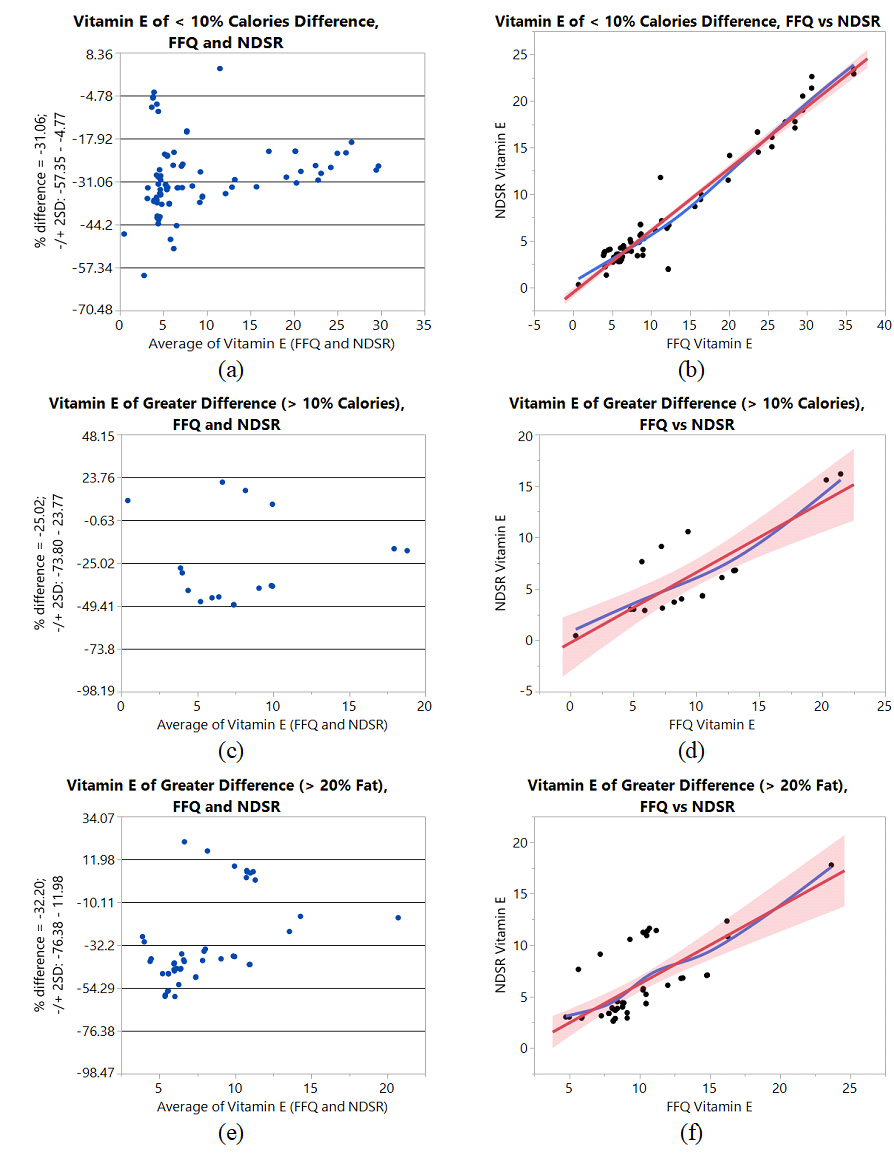
Figure S3a-f. Bland-Altman plots between two dietary measures on vitamin E; (a-b): ≤10% calorie difference, (c-d): >10% calorie difference, (e-f): >20% fat difference.

Figure S4a-f. Bland-Altman plots between two dietary measures on vitamin C; (a-b): ≤10% calorie difference, (c-d): >10% calorie difference, (e-f): >20% fat difference.
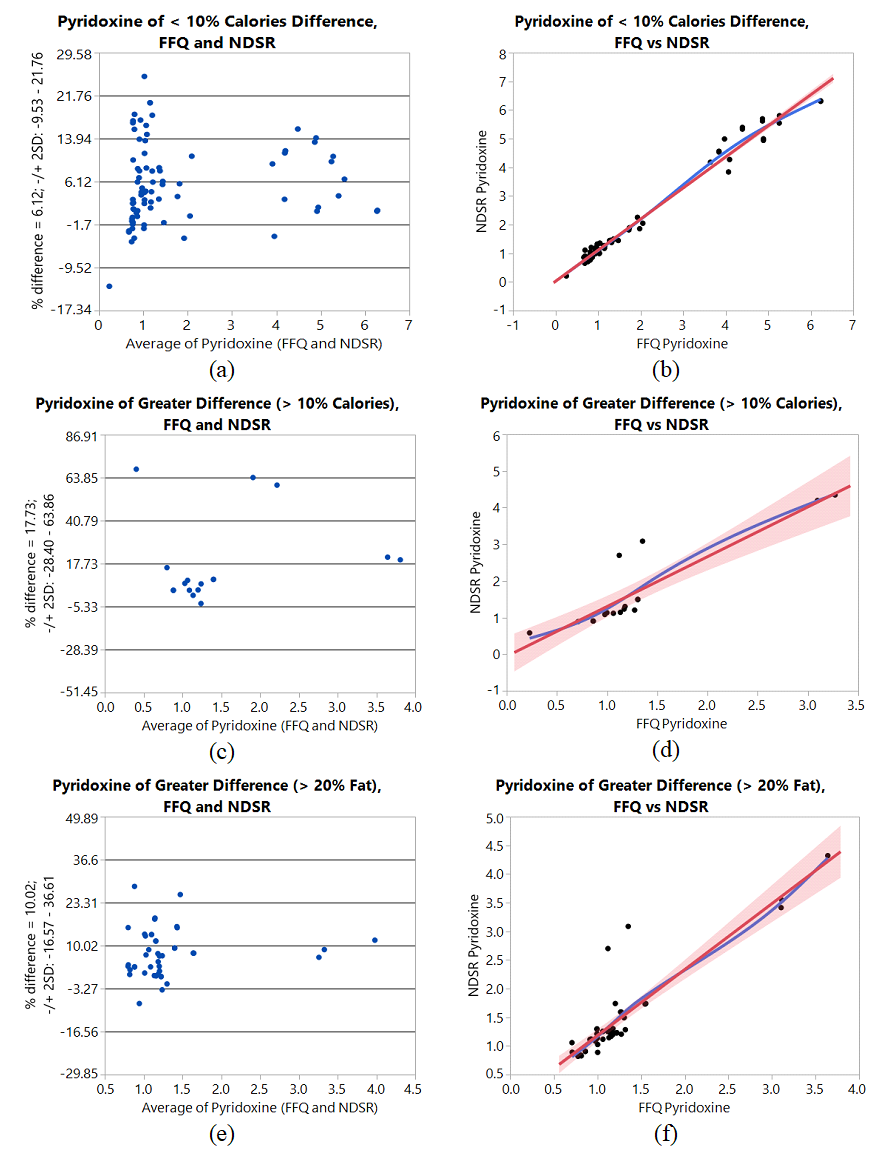
Figure S5a-f. Bland-Altman plots between two dietary measures on pyridoxine; (a-b): ≤10% calorie difference, (c-d): >10% calorie difference, (e-f): >20% fat difference.
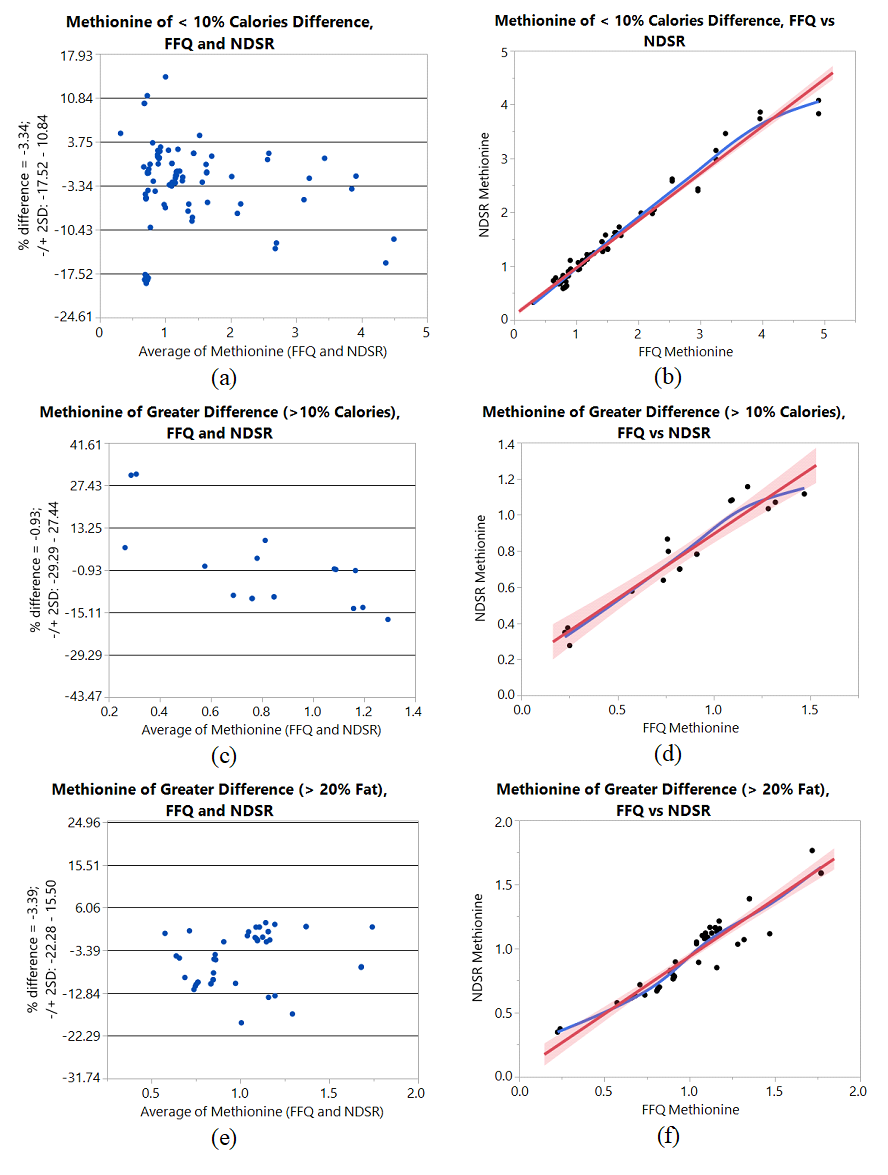
Figure S6a-f. Bland-Altman plots between two dietary measures on methionine; (a-b): ≤10% calorie difference, (c-d): >10% calorie difference, (e-f): >20% fat difference.
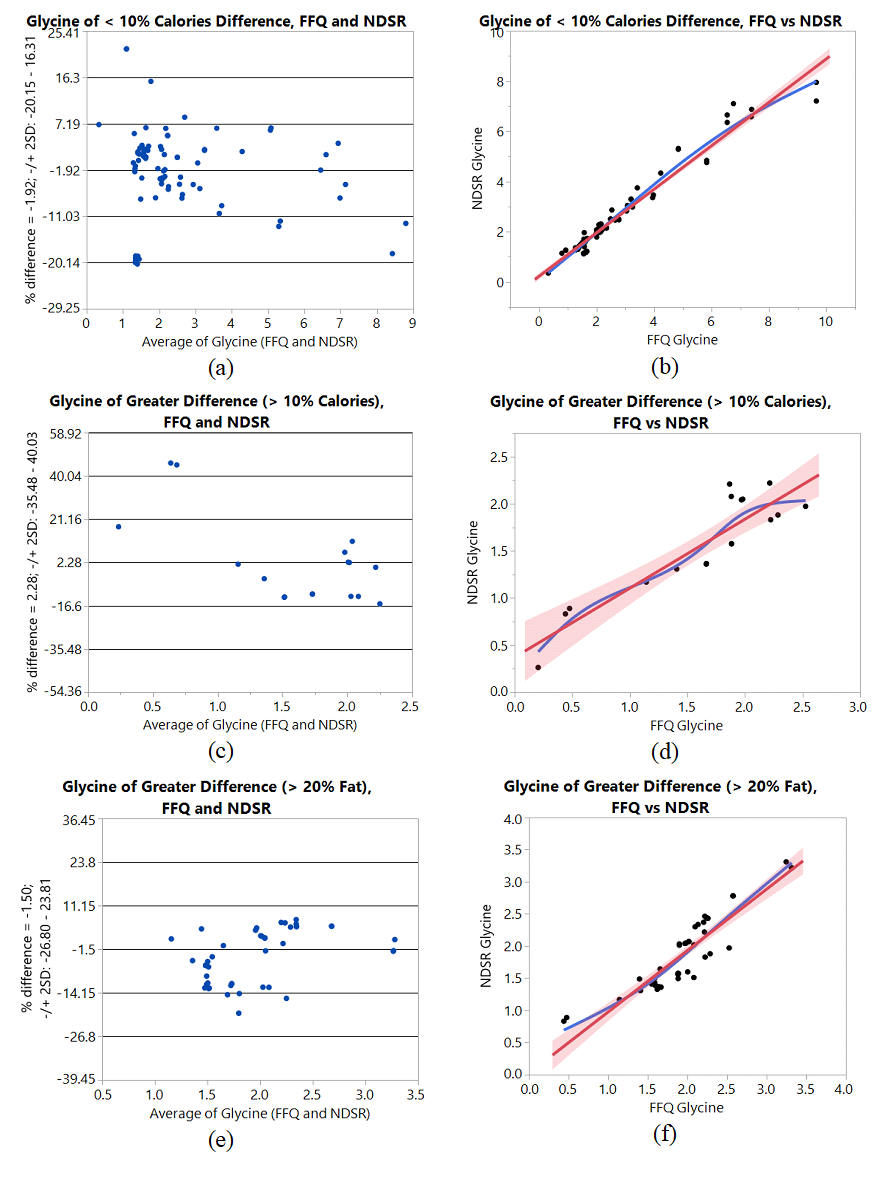
Figure S7a-f. Bland-Altman plots between two dietary measures on glycine; (a-b): ≤10% calorie difference, (c-d): >10% calorie difference, (e-f): >20% fat difference.
The authors acknowledge the contribution and assistance from Zenab Khan, for coding, entering, and double checking the data.
Funding
Funding support included the Doctoral Research Council Grants, Azusa Pacific University; Research Start-up fund from Augusta University awarded to the corresponding author.